Search and extract government statistics, then analyze them through to the implications
Copyright © 2026GotoAI Inc.Based on the goose project
The steps on this page were verified in the following environment.
- Kari: version 0.6.0, Windows
- AI provider: Anthropic Claude subscription
- Model: Opus 5 (1M)
About this use case
e-Stat, the portal site for official statistics of Japan, is — in the site's own words — "the portal site for Japanese government statistics". Through a web browser you can search and download a wealth of data.
Many companies build similar internal data portals. But having a lot of data does not by itself produce an analysis with implications. In conventional data analysis, the analyst clarifies the business intent, then selects the datasets, checks their specification and quality, explores them and tests hypotheses, and from that extracts something useful. Naturally, it takes a lot of hours.
With Kari's browser automation, an AI agent can select the data, check its specification and quality, explore it and test hypotheses through the browser, carrying the work from analysis through to implications in one pass.
Scenario
The user wants to understand the wage situation of non-regular employment in Japan's food service industry. They do not know which statistical table to use. Everything from selecting the dataset to extracting the figures and reading the trends is left to the AI agent.
In this example, starting from e-Stat, the AI finds the last five years of data, organizes the figures, and reports the trends, problems and implications.
Preparing the work
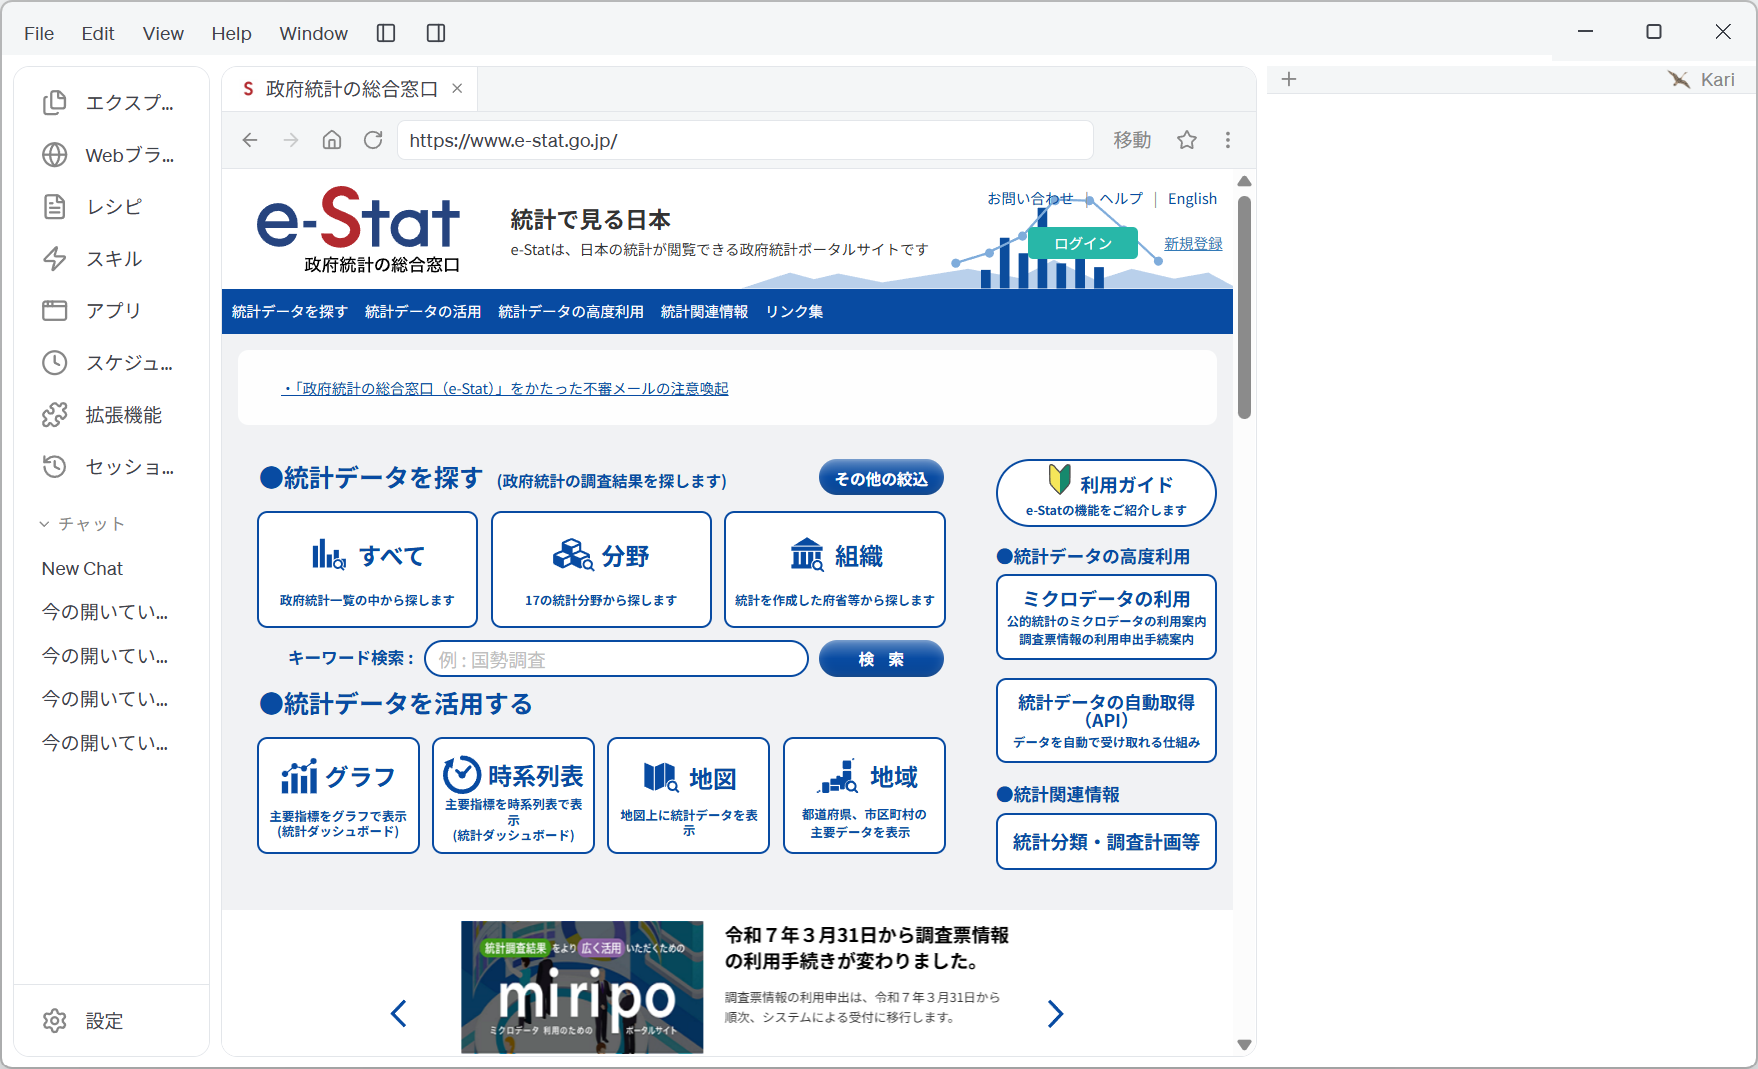
- Open Web Browser in the left navigation panel and go to the target page. No sign-in is needed to view public data. URL: https://www.e-stat.go.jp/
Screenshot shown in the original Japanese.
- Under 「統計データを探す」 (find statistical data) there are three ways in — 「すべて」 (all), 「分野」 (by field) and 「組織」 (by organization) — plus keyword search. Even when you have not decided which statistics to use, you can have the AI find them from a keyword.
e-Stat provides an API for retrieving statistical data automatically. For routinely retrieving large volumes of data, the API is more reliable and puts less load on the site. What the steps on this page suit is the stage where you have not settled on a statistical table and are narrowing it down as you explore.
Instruct the AI
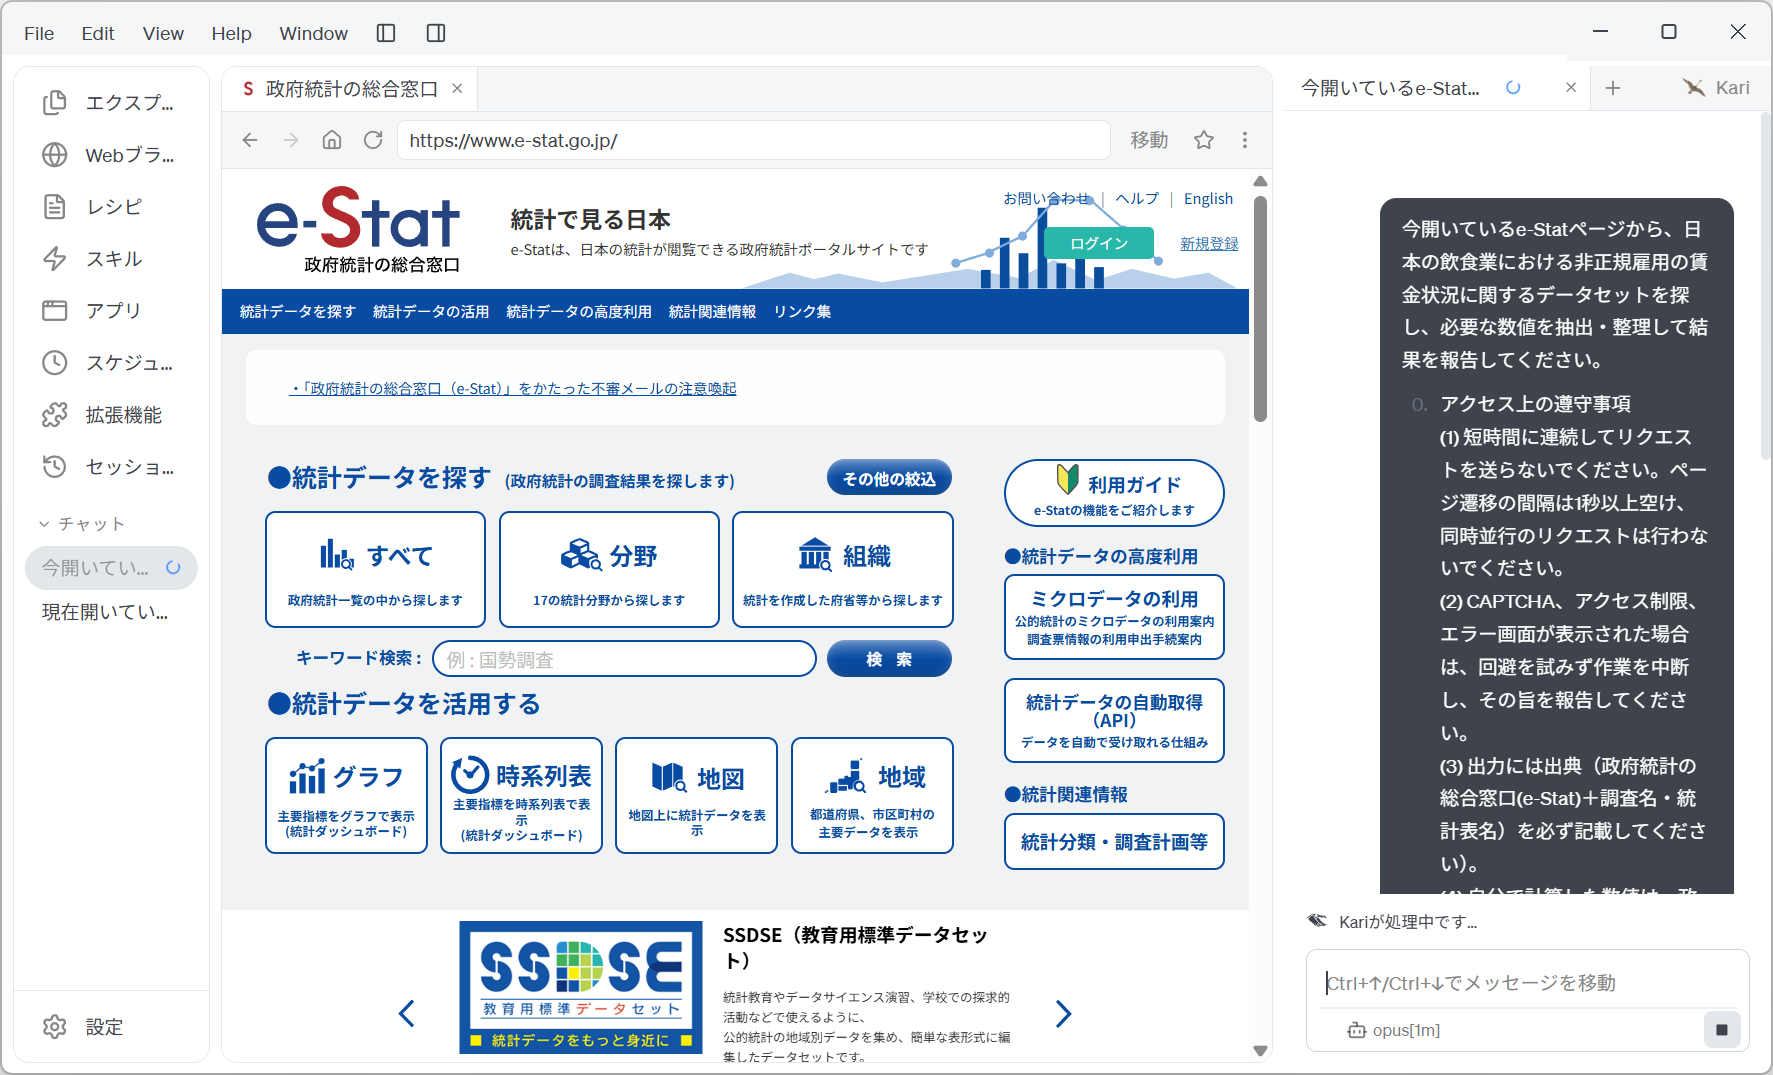
- Set out the theme you want to investigate together with the constraints specific to statistical data — stating the source, and distinguishing calculated values — and instruct the AI as follows. The prompt below is an English rendering of the Japanese prompt shown in the screenshot.
From the e-Stat page that is currently open, find datasets on the wage situation of non-regular employment in Japan's food service industry, extract and organize the figures you need, and report the results.

0. Access rules to observe
(1) Do not send requests in rapid succession. Leave at least one second between page transitions, and do not make concurrent requests.
(2) If a CAPTCHA, an access restriction, or an error screen appears, do not try to work around it — stop and report it.
(3) Always state the source in the output (the portal site for official statistics of Japan (e-Stat), plus the survey name and the statistical table name).
(4) Show any figure you calculated yourself in a form that distinguishes it from the government's published figures.

1. Use the Browser tool; do not use the Web Fetch tool.

2. Where annual or fiscal-year data exists, use the last five years of it.

3. Report the results in a chat message as bullet points plus tables, covering:
(1) The datasets used
(2) The number of non-regular workers, their working hours and their wage levels
(3) The trends, problems and implications you can see
Screenshot shown in the original Japanese.
The way this instruction is put together has a few key points.
| Block of the instruction | What it is for |
|---|---|
| 0. Access rules (1)(2) | Spells out the interval and serial execution so the site is not put under load. |
| 0. (3) Stating the source | Requires the survey name and the statistical table name. "From e-Stat" alone does not identify which series in which table, so it cannot be verified. |
| 0. (4) Distinguishing calculated values | The most important specification in this example. With government statistics, the distinction between a published figure and one derived from it by division or the like is decisive. This single sentence makes the AI mark calculated figures with 【自算】 (own calculation). |
| 1. Tools | Limits the work to browser operation. |
| 2. Period | A conditional specification: "where annual or fiscal-year data exists". It makes the AI check the granularity of the data before deciding the period. |
| 3. Output | "The datasets used" in (1) is what makes the work traceable. Insist on more than the conclusion: which table each figure came from. |
In analyzing statistical data, the greatest risk is that the provenance of a figure becomes vague. Published figures, calculated figures and conjecture must always be kept apart. If you do not write that into the instruction, they come out mixed together.
Check the AI's work
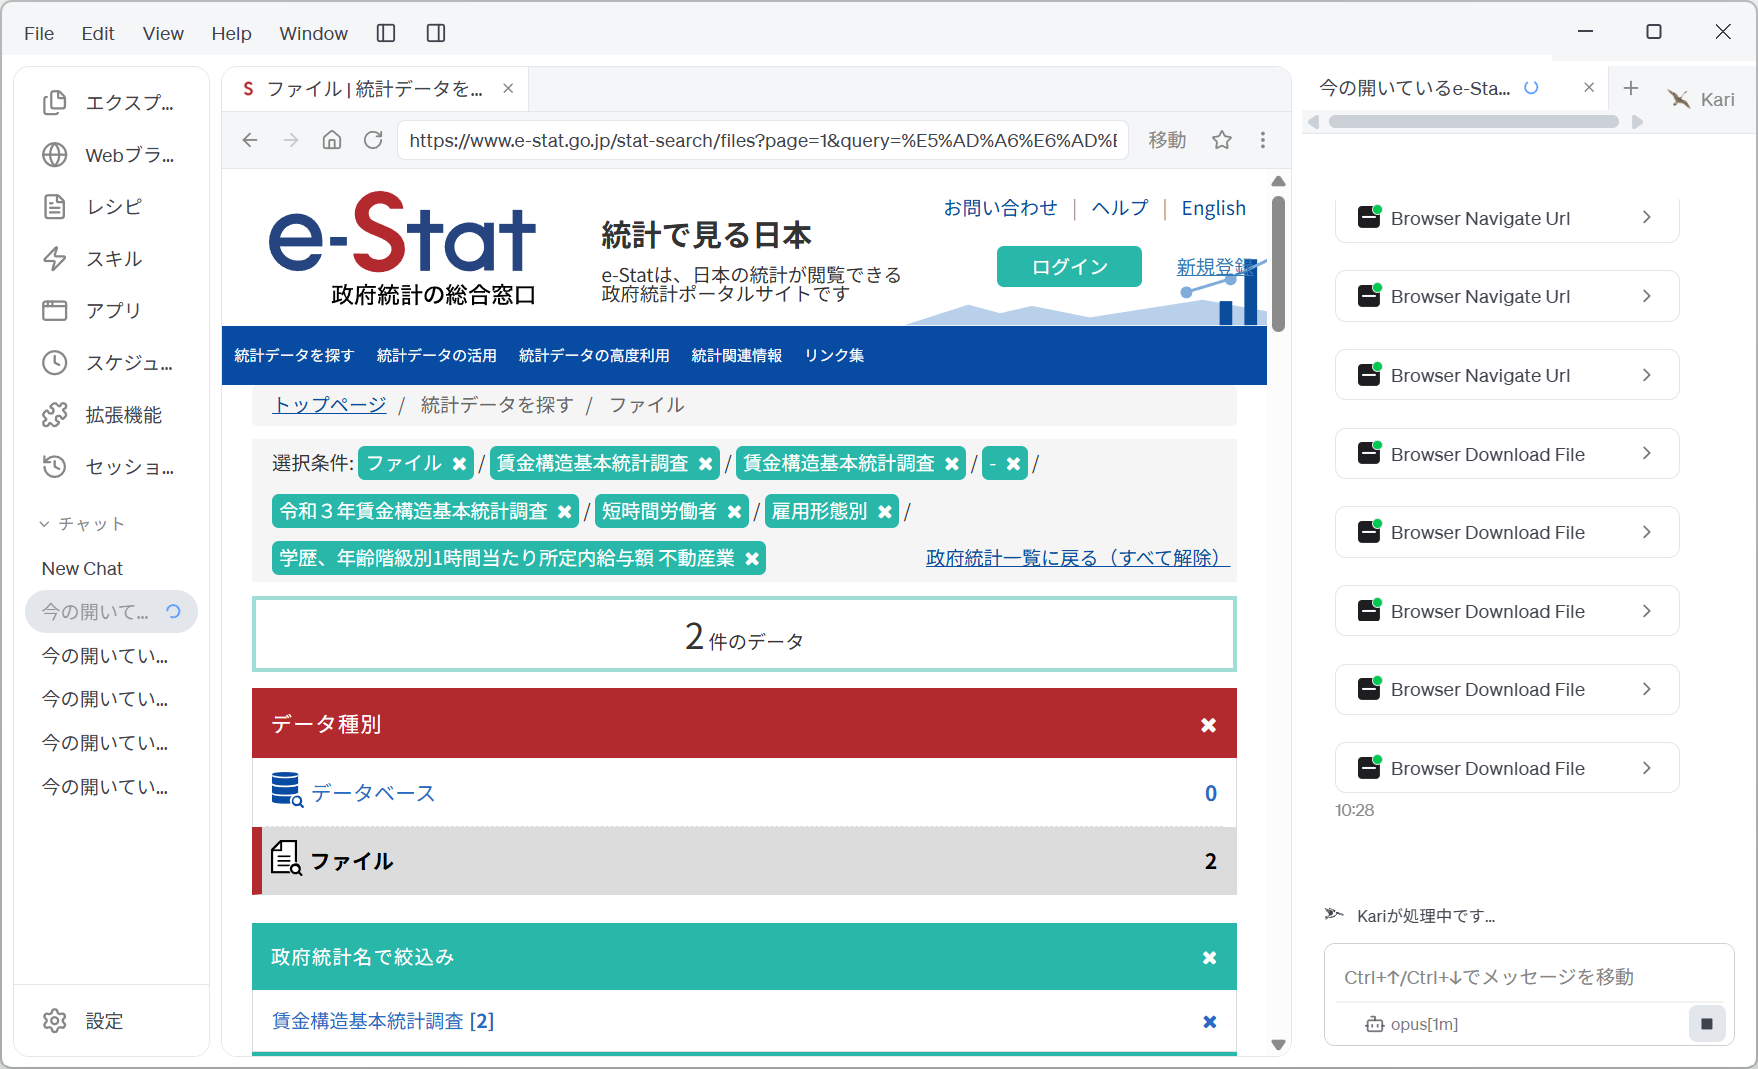
- The AI works the e-Stat search conditions to narrow down the candidate tables, downloads the relevant files and reads them. While it works, the tool activity is shown in the session window.
Screenshot shown in the original Japanese.
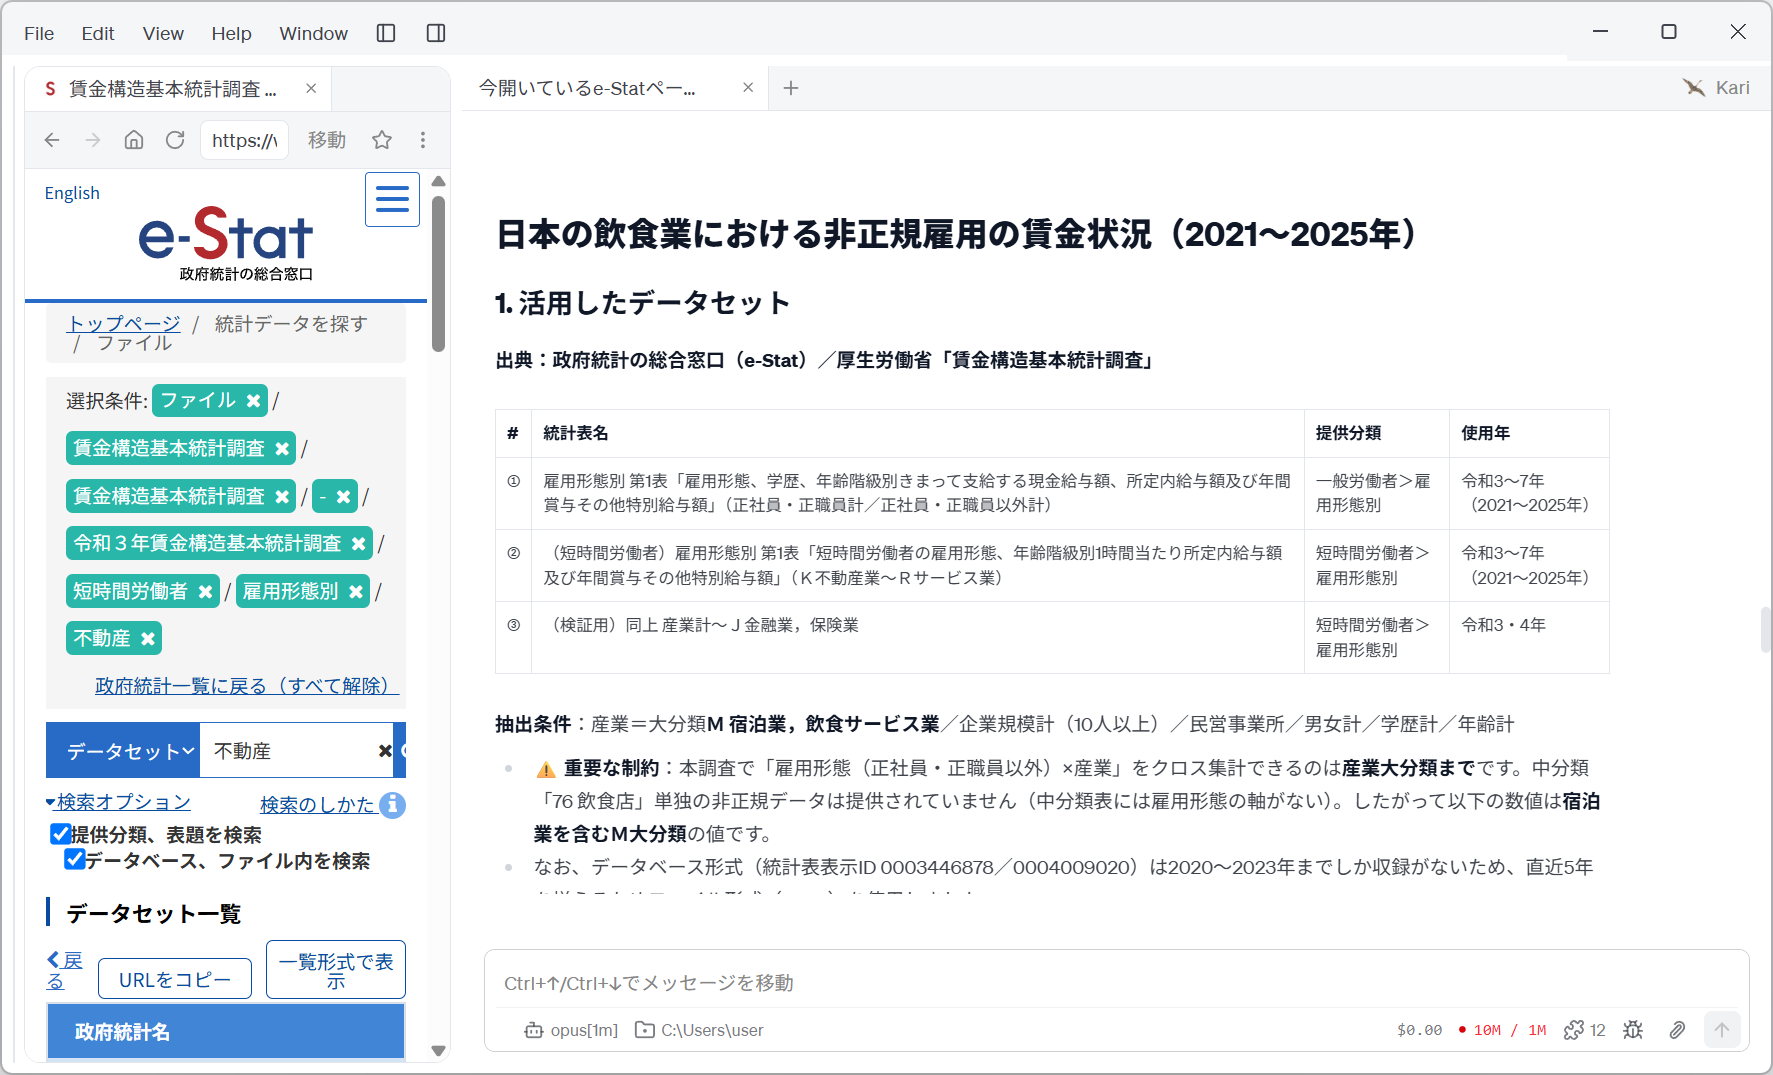
- When the run finishes, "the datasets used" is printed first, as a table of the source, the statistical table name, the classification under which it is provided, and the years used.
Screenshot shown in the original Japanese.
This section carries the most important part of the report in this example.
- The source is the portal site for official statistics of Japan (e-Stat) / the Ministry of Health, Labour and Welfare's Basic Survey on Wage Structure (「賃金構造基本統計調査」). Three statistical tables were used, each identified down to the table name.
- ⚠ An important constraint: employment type × industry can only be cross-tabulated down to the major industry group; no non-regular data is provided for the middle group "76 food service establishments" on its own. The figures that follow are therefore for major group M, which includes accommodation.
- The database format only holds 2020 to 2023, so the file format (Excel) was used in order to line up the last five years.
- The third table was retrieved for verification, covering all industries through to major group J (finance and insurance).
In other words, the AI discovered that data at the granularity the user asked for does not exist, chose an alternative granularity, and stated the difference explicitly. That is exactly the specification-and-quality check that analysis work consists of.
- The number of workers, working hours and wage levels follow, in tables.
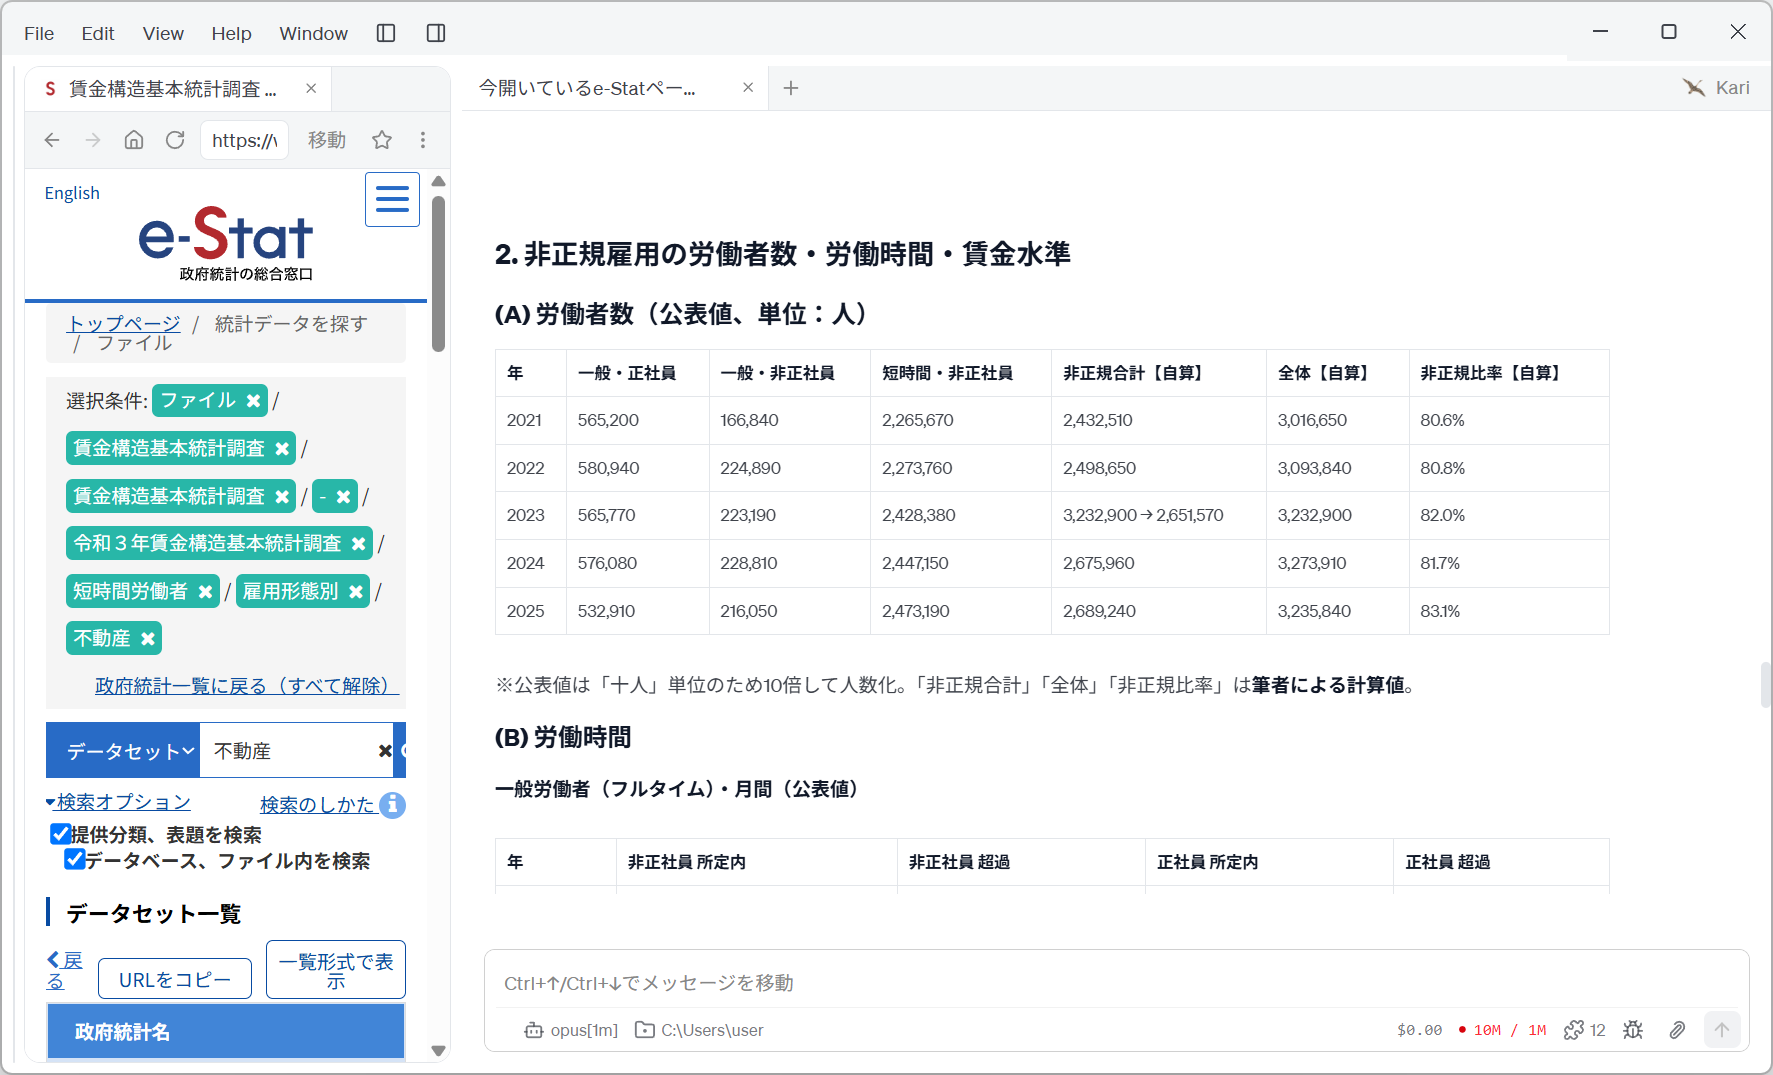
Screenshot shown in the original Japanese.
Look at the column headings. "General, regular employee", "general, non-regular employee" and "part-time, non-regular employee" are published figures, but "non-regular total 【自算】", "overall 【自算】" and "non-regular share 【自算】" carry the 【自算】 (own calculation) marker. Below the table is a note: "published figures are in units of ten persons, so they are multiplied by 10 to give a headcount; 'non-regular total', 'overall' and 'non-regular share' are the author's calculated values". Point 0.(4) of the instruction has been observed.
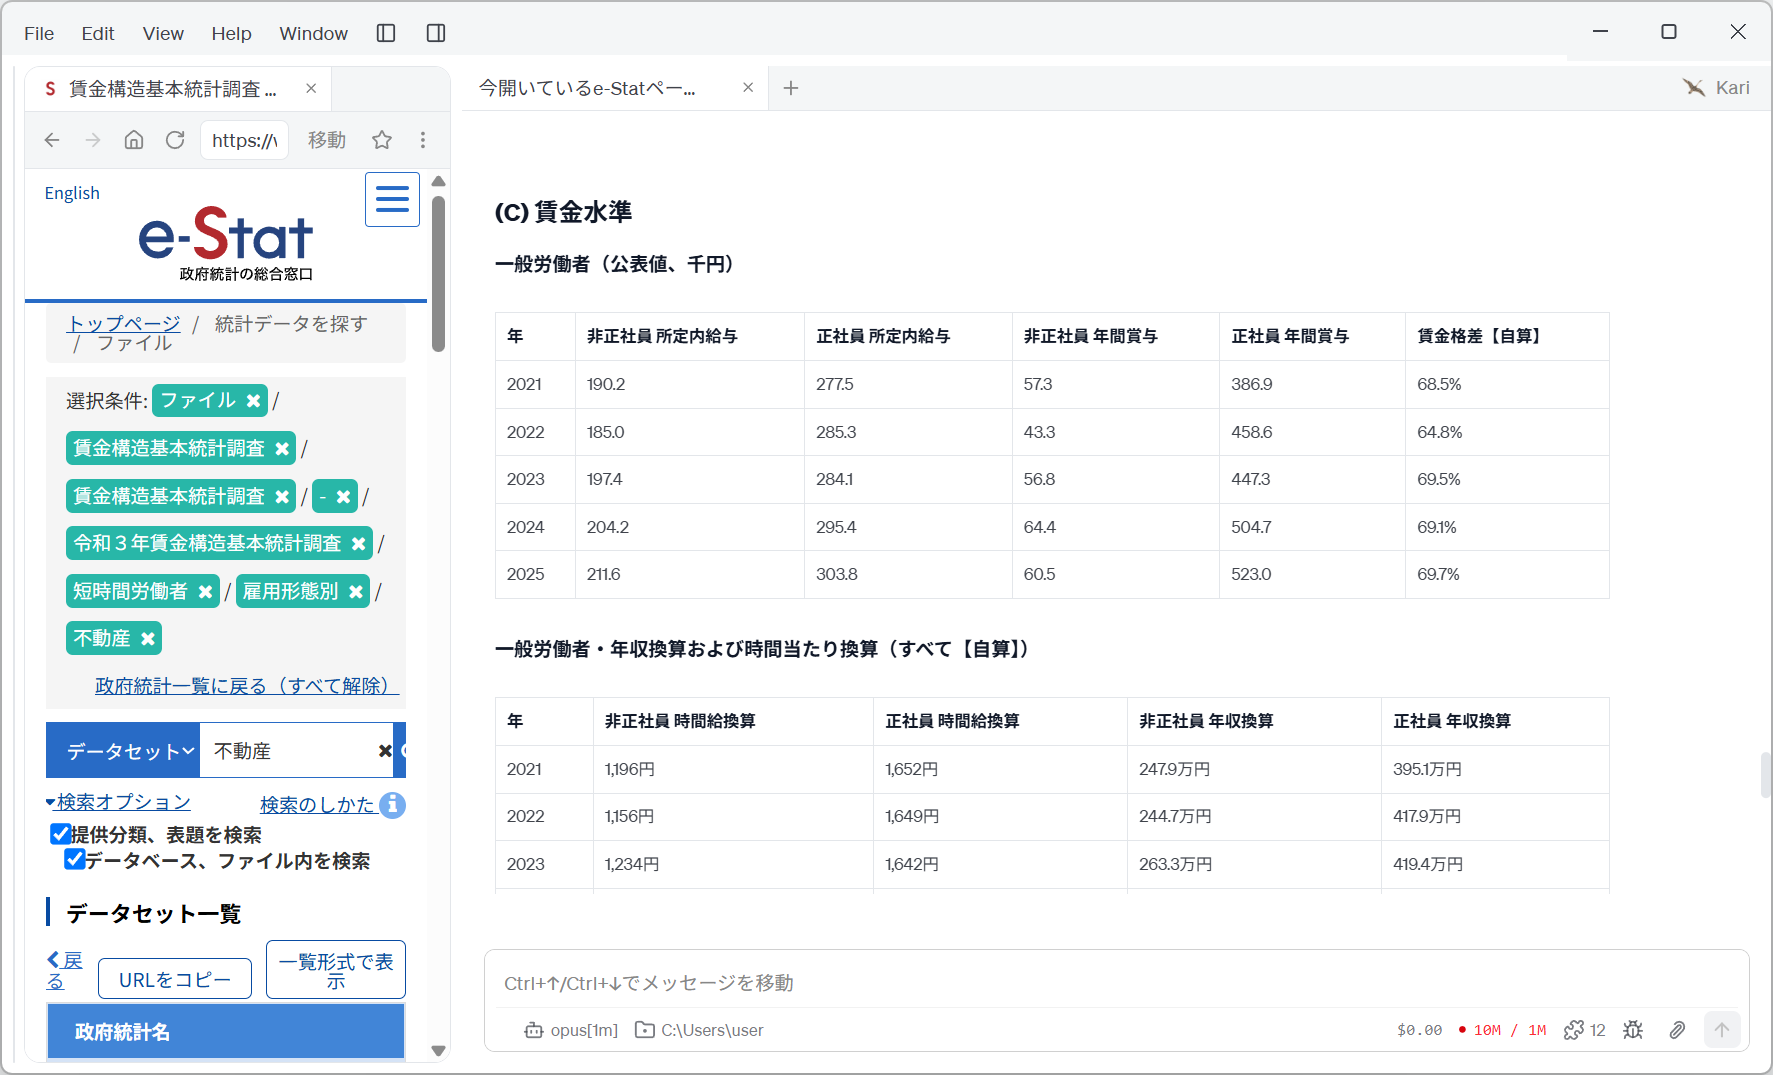
Screenshot shown in the original Japanese.
Wage levels are handled the same way, with the table of published figures (contractual cash earnings, annual bonuses) kept separate from the 【自算】 table (hourly-rate and annual-income conversions).
- Finally, the trends, problems and implications are summarized.
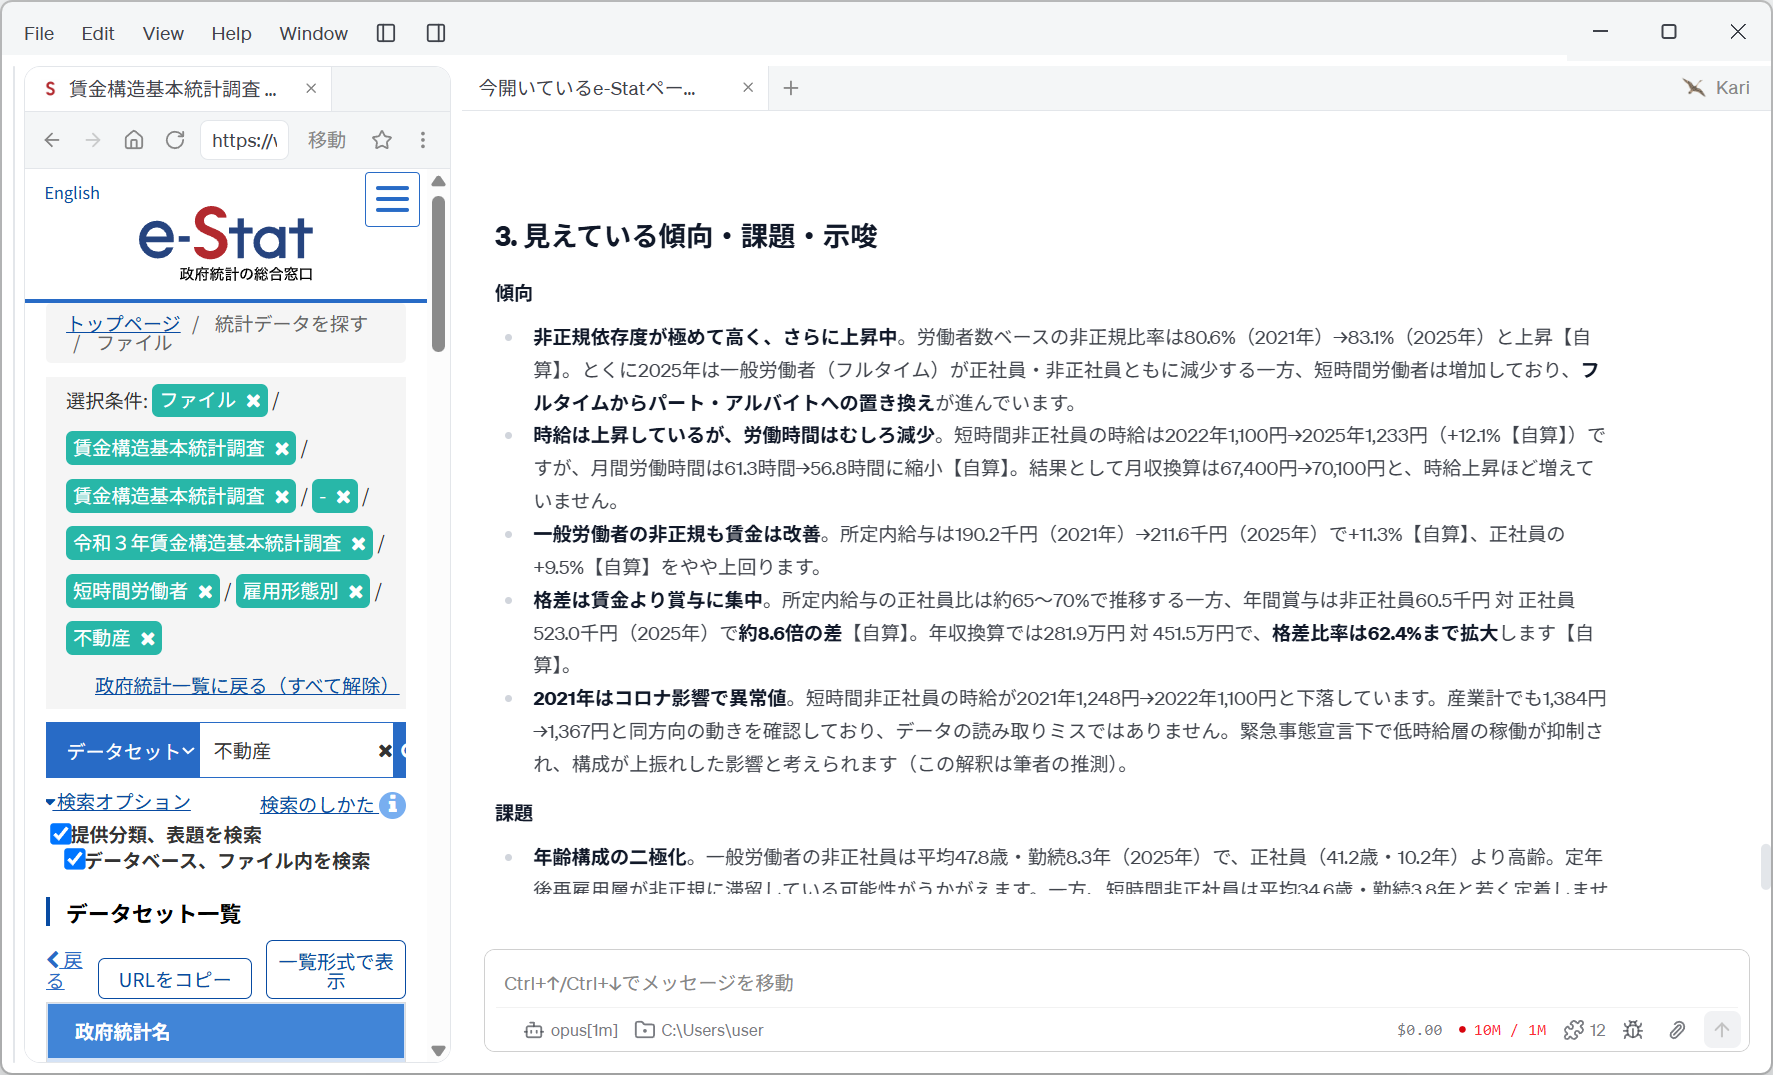
Screenshot shown in the original Japanese.
Among the points raised: the non-regular share rose from 80.6% (2021) to 83.1% (2025); the hourly rate is rising but working hours are shrinking, so monthly earnings have not risen as much as the hourly rate; and the gap is concentrated in bonuses rather than in wages. For the anomalous 2021 figure, the AI confirmed the same direction of movement in the all-industries data it had retrieved for verification, and on that basis judged that this was not a misreading of the data; as for the cause, it states explicitly that "this interpretation is the author's conjecture".
Human-in-the-loop points
Do not leave everything to the AI. Check the following yourself.
-
Check the distinction between 【自算】 and published figures When you use this as material, always distinguish which figures are the government's published values and which are the AI's calculations. Citing a calculated value as a published one misattributes the source. For figures marked 【自算】, check the formula too — what was used as the numerator and the denominator.
-
Read the constraint on granularity The figures here are not for "the food service industry" but for major industry group M, which includes accommodation. Overlook that constraint and cite "the non-regular share in the food service industry is 83.1%", and you are wrong. The AI reporting the constraint is of no use if you skim past it.
-
Check how units were handled Here the published figures are in units of ten persons, so the AI multiplied by 10 to convert to a headcount. Statistical tables contain units, suppressed values, and symbols such as "-" and "X" that cannot be used in a calculation as they stand. Open the original table and confirm that the conversion is sound.
-
Separate fact from interpretation In "2021 is an anomaly caused by COVID", the movement in the figures is fact and the explanation of the cause is conjecture. The AI states here that "this interpretation is the author's conjecture", but output that fails to draw the distinction is entirely possible.
-
Check the source down to the table name Search e-Stat for the statistical table name in "the datasets used" and confirm that you arrive at the same table. If the table cannot be identified, the figures cannot be verified.
-
Watch for differences in the period covered Here the database format and the file format covered different periods. Even within one survey, which data is usable varies with the format it is provided in. With a relative specification such as "the last five years", check which format the data came from.
-
Consider using the API If you will retrieve the same data on a continuing basis, e-Stat's API is the more reliable route. Browser automation is a means suited to the exploratory stage.
The choice of statistical table and the accuracy with which figures are read vary with the LLM used. Always check the figures against the original statistical table.
References
The steps on this page use the following public statistics for illustration. Screenshots are reproduced as quotations with the source stated. The tables, calculated values and observations on trends that the AI produced were generated by GotoAI as an example of Kari's operation; they were not created or published by the Ministry of Health, Labour and Welfare or the Statistics Bureau of Japan.
- Material: Basic Survey on Wage Structure (「賃金構造基本統計調査」; Table 1 by employment type, and Table 1 by employment type for part-time workers)
- Provider: Ministry of Health, Labour and Welfare (provided through e-Stat, the portal site for official statistics of Japan)
- URL: https://www.e-stat.go.jp/
- Accessed: September 18, 2026
- Terms of use: Used with the source stated, in accordance with e-Stat's terms of use. Source: the portal site for official statistics of Japan (e-Stat) / Ministry of Health, Labour and Welfare, Basic Survey on Wage Structure.
- The external information quoted on this site is provided to illustrate examples of using Kari. This site does not guarantee the accuracy or currency of that information. Quoted sources may be changed or removed without notice.
- The AI output shown on this site was actually obtained in the stated verification environment. However, this site does not guarantee the accuracy or usefulness of that output. AI output varies with the LLM used, its settings, and from one run to the next.
- The figures on this page marked 【自算】 are values the AI calculated from published figures; they are not the government's published values. Always distinguish them when citing.
- The figures on this page are for major industry group M (accommodation, eating and drinking services), not for the food service industry on its own.
- Before using statistical data in your work, always check the original statistical table and the survey outline (the population surveyed, the tabulation method, the units, the suppression rules), and make your own judgement, at your own responsibility.
- The trends, problems and implications include interpretation by the AI. Keep the movement in the figures separate from the explanation of its cause.
- Screenshots were taken with the version of Kari current at the time of writing. The display may differ in your version.
- The organizations quoted have no affiliation with, and do not endorse, this site or Kari.