Have Kari's AI agent automate visualizing trends in estimated total spending by nationality and region, and drawing out insights
Copyright © 2026GotoAI Inc.Based on the goose project
The steps on this page were verified in the following environment.
- Kari: version 0.7.3, Windows
- AI provider: Anthropic Claude subscription
- Model: Claude Opus 5.5 High
About this page
On the previous page, we looked at the trend in visitor numbers. What we want to know next is how much was spent — that is, total spending. We have the following two pieces of data.
| Data | Source | Granularity |
|---|---|---|
| Travel spending per person | Consumption Trend Survey for Foreigners Visiting Japan (「インバウンド消費動向調査」), 「参考2」 (Reference 2) | Quarterly |
| General visitors | JNTO's statistics on visitor arrivals (「訪日外客統計」) − immigration control statistics (「出入国管理統計」) | Monthly |
From these two, total spending is estimated with the following formula.
Estimated total spending = travel spending per person × general visitors
There is just one multiplication. Because the preparation on the previous pages — aligning the granularity, reconciling country names and subtracting cruise passengers — is done, the calculation itself is simple here. The theme of this whole use case shows up as it is: the difficulty of the analysis lies not in the formula but in the preparation.
The consumption survey workbook has several tables that give an amount per person. The result changes by 10% depending on which one you use.
| Sheet | Content | All nationalities, April–June 2026 | Notes |
|---|---|---|---|
表2-1 (Table 2-1) | Purchase rate and spending per purchaser by expense item | (222,119 yen when multiplied and summed) | |
表3-1 (Table 3-1) | Travel spending per person per trip | 222,119 yen | |
参考2 (Reference 2) | Same as above (including the breakdown of package tour fees) | 244,733 yen | Used in this use case |
Multiplying the purchase rates in 表2-1 by the spending per purchaser and adding them up matches 表3-1, but because the domestic portion of package tour fees drops out, the result comes out about 10% low. The total spending that the Japan Tourism Agency publishes rests on the 参考2 series.
This use case uses the 「全体」 (overall) values in 参考2 as they are. There is no need to compose the spending per person yourself, and composing it gives you a different series.
Incidentally, the fact table built on the previous page was designed for this calculation. The keys (nationality/region × year and month) are aligned, and travel spending per person and the number of general visitors sit in the same row, so a single column multiplication gives the estimate.
Travel spending per person is a quarterly value copied to each month (see the data joining page). The month-to-month variation in this estimate therefore comes only from the variation in the number of general visitors.
In addition, the survey is a sample survey, and the number of general visitors is an approximation calculated as "visitor arrivals − cruise landing permits". The amounts obtained here do not match the spending published by the Japan Tourism Agency. The figures on this page are strictly estimates calculated as an example of how Kari works.
Instruct the AI
- Instruct the AI on everything together: the formula, the period, the exclusion conditions, the Chart and drawing out insights. The prompt below is an English rendering of the Japanese prompt shown in the screenshot; Dataflow and column names are quoted as they appear in Kari.
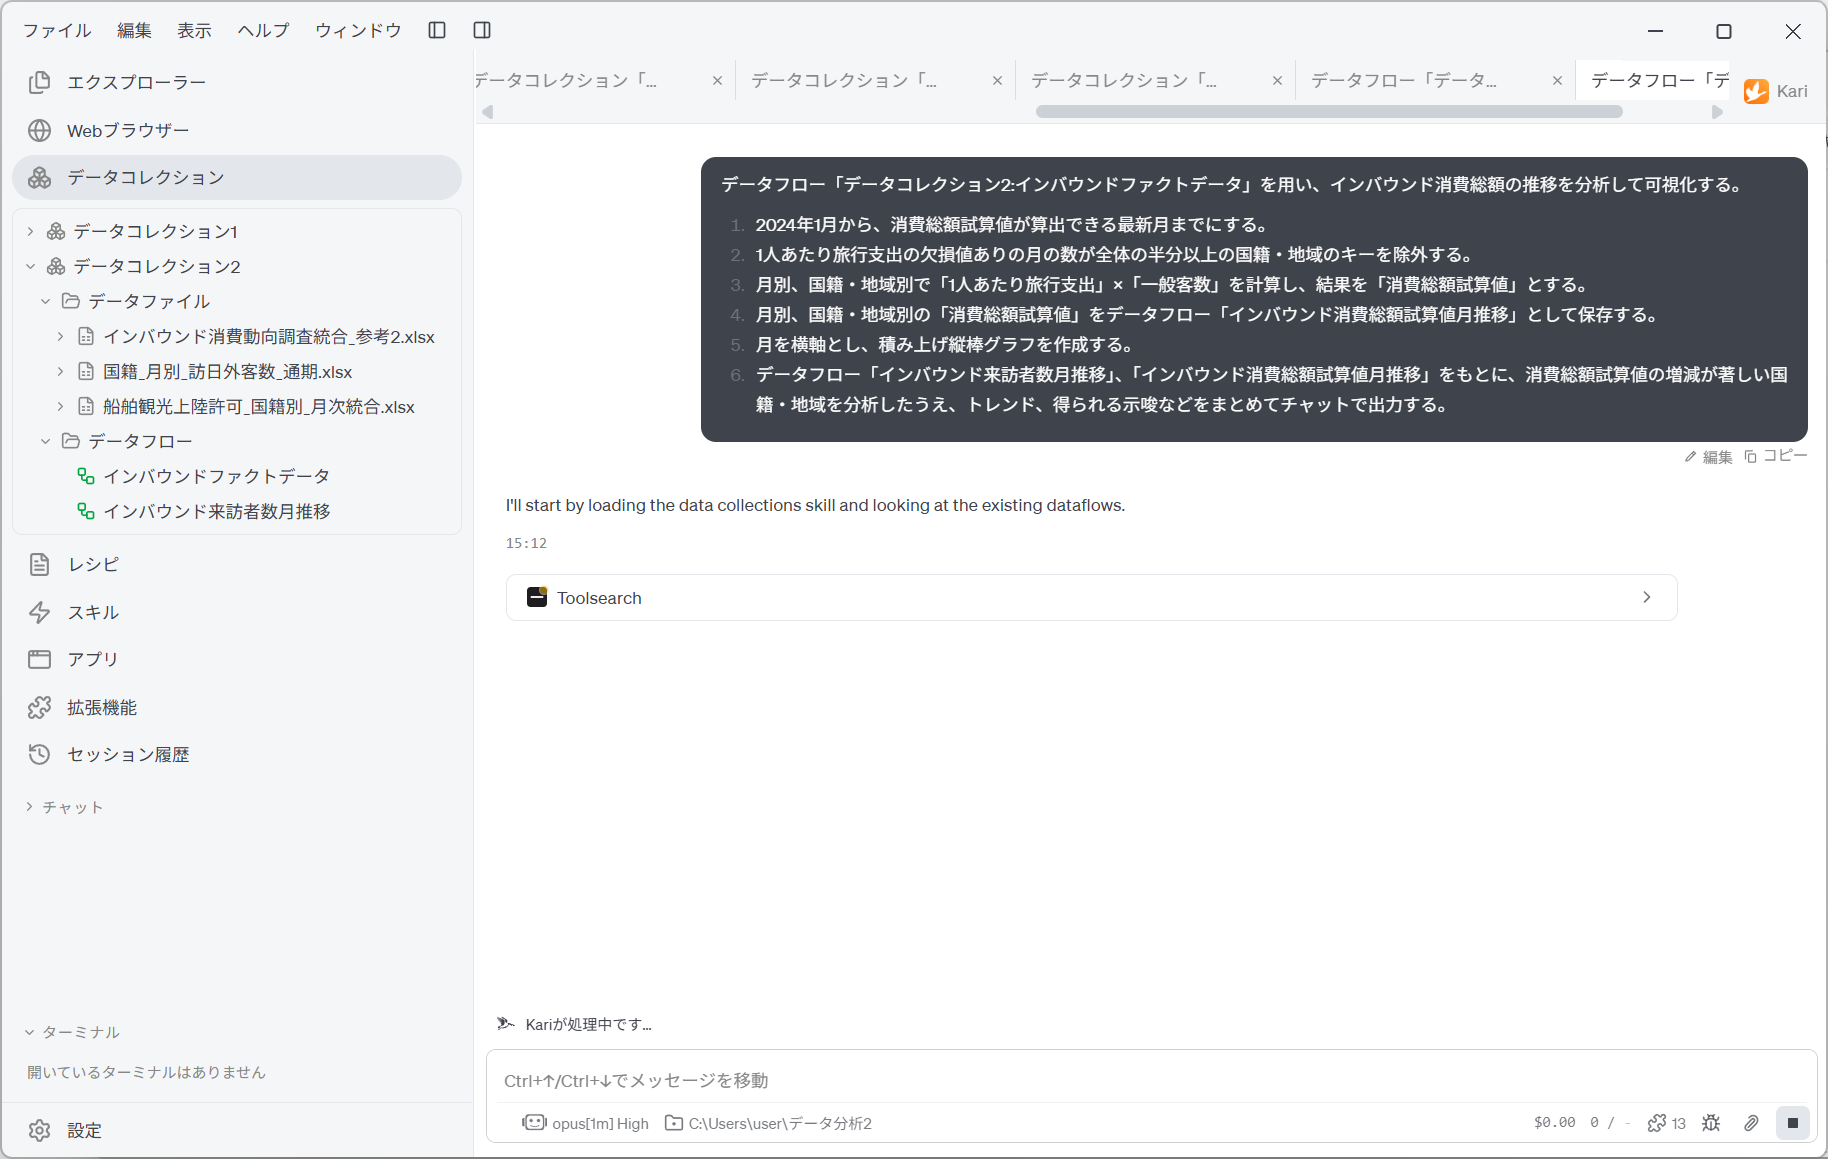
Using the Dataflow 「データコレクション2:インバウンドファクトデータ」, analyze and visualize the trend in total inbound spending.

1. Cover the period from January 2024 to the latest month for which estimated total spending can be calculated.
2. Exclude the nationality/region keys for which the number of months with missing values in travel spending per person is half or more of the total.
3. For each month and each nationality/region, calculate 「1人あたり旅行支出」 (travel spending per person) × 「一般客数」 (general visitors), and call the result 「消費総額試算値」 (estimated total spending).
4. Save the monthly 「消費総額試算値」 by nationality/region as the Dataflow 「インバウンド消費総額試算値月推移」.
5. Create a stacked column chart with month on the horizontal axis.
6. Based on the Dataflows 「インバウンド来訪者数月推移」 and 「インバウンド消費総額試算値月推移」, analyze the nationalities/regions whose estimated total spending increased or decreased markedly, then summarize the trends, the insights they give, and so on, and output them in the chat.
Screenshot shown in the original Japanese.
The way this prompt is put together has the following points.
| Block of the prompt | Aim |
|---|---|
| 1. Specifying the period | Here too the end is specified by a condition. Travel spending per person runs to the April–June 2026 quarter, the number of general visitors to July 2026. The AI is made to cut off at the shorter of the two. |
| 2. Exclusion for missing values | The same condition as on the previous page. If the visitor-number analysis and the spending analysis covered different keys, you could not read the two Charts side by side. |
| 3. The formula | Just one multiplication is specified. Because the fact table holds "travel spending per person" as a column, there is no need to rebuild the spending per person here. |
| 4. Saving the intermediate result | The AI is made to keep the estimates as a Dataflow. In step 6 it reads them back. |
| 6. Referring to two Dataflows | The AI is made to read both visitor numbers and spending. With only one of them, it cannot find discrepancies such as "visitors grew but spending did not". |
| 6. Analyzing the keys with marked changes | Rather than the overall trend, the AI is made to identify which markets drove it. |
Having the AI refer to two Dataflows in step 6 is the key to this page. If it reads only the spending, it ends at "the amount went up or down". Only by putting it alongside visitor numbers can it make findings of the form "there were more people, but the amount did not increase".
Check the Chart that was created
Screenshot shown in the original Japanese.
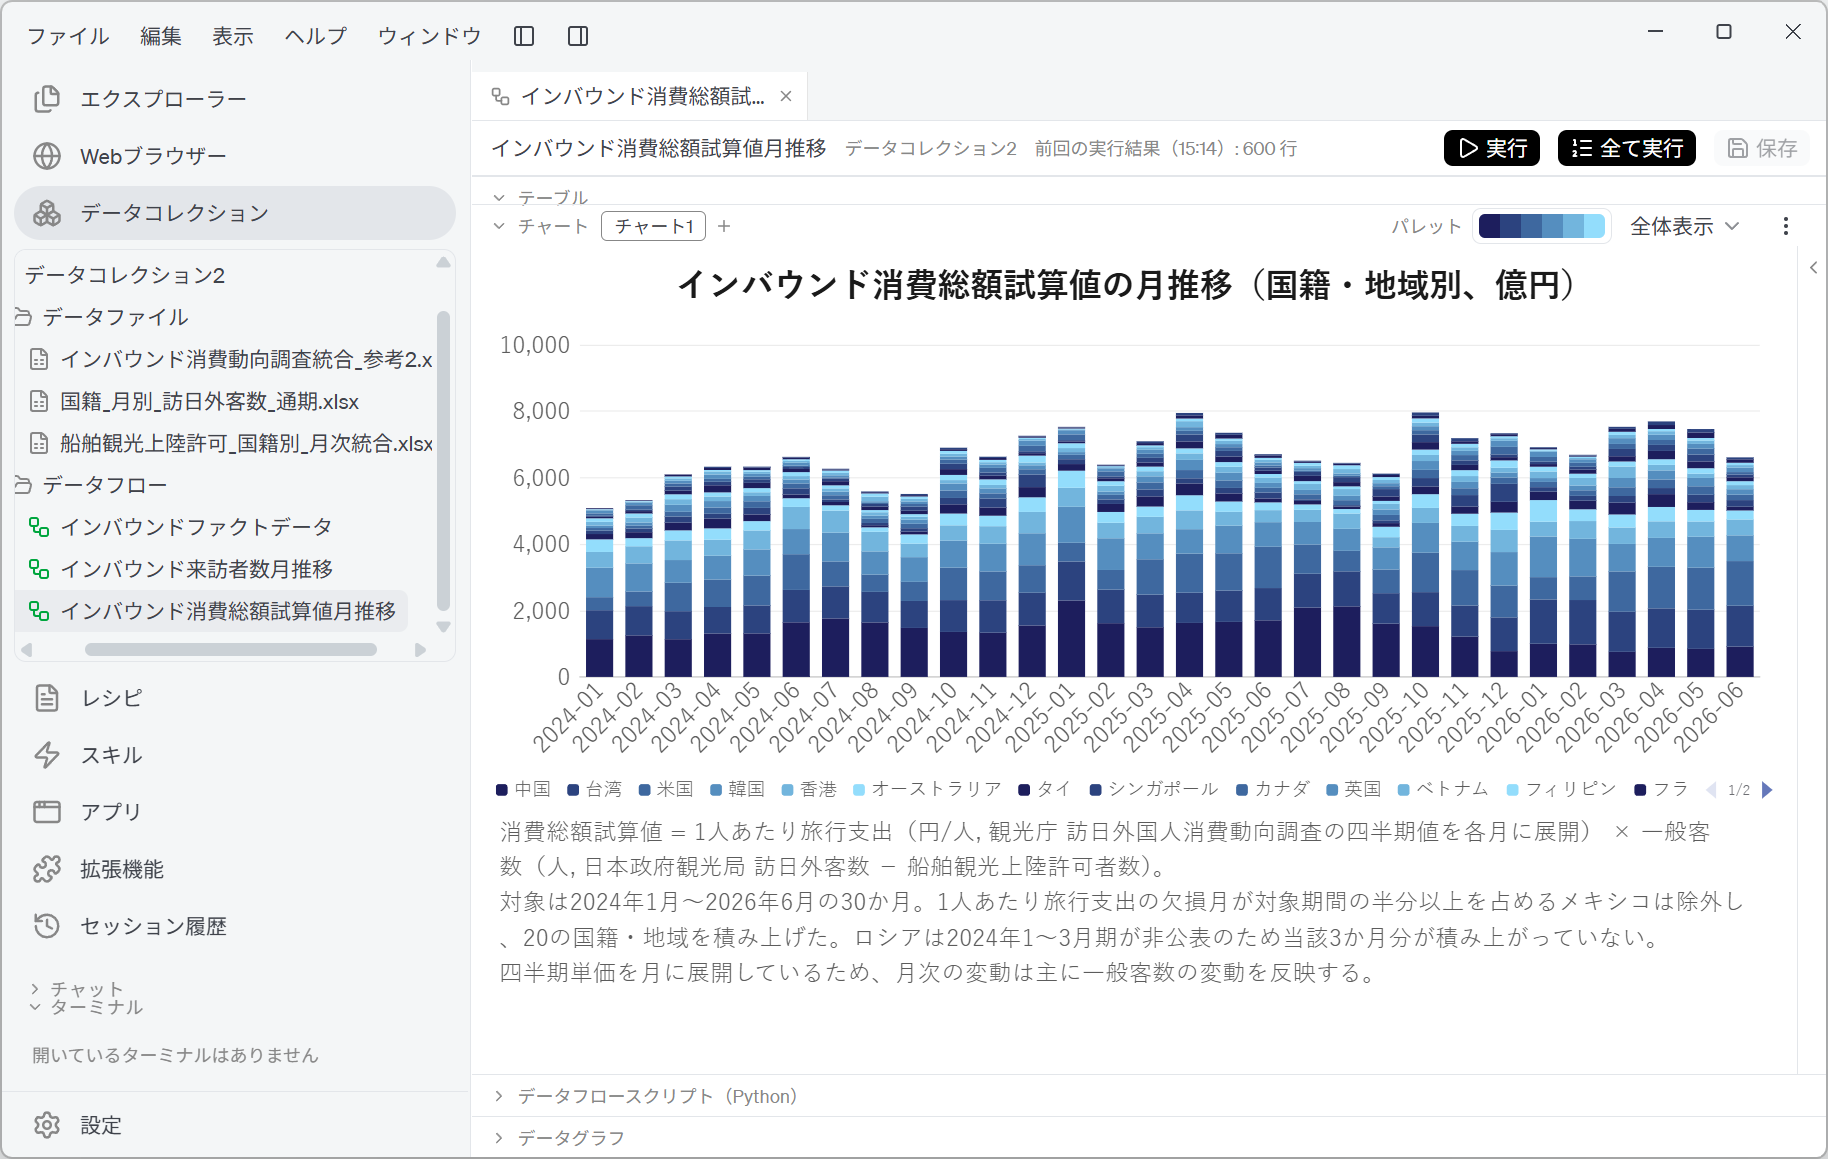
The Dataflow 「インバウンド消費総額試算値月推移」 (monthly trend in estimated total inbound spending) has 600 rows: 20 nationalities and regions × 30 months. The vertical axis is in units of 億円 (100 million yen); amounts on this page are given in billions of yen (the 億円 figure divided by 10).
The note has three paragraphs, setting out the formula, the scope and the limits on how to read the Chart respectively.
Estimated total spending = travel spending per person (yen/person; the Japan Tourism Agency's Consumption Trend Survey for Foreigners Visiting Japan, quarterly values spread across each month) × general visitors (persons; JNTO visitor arrivals − people granted cruise landing permits).
Covers the 30 months from January 2024 to June 2026. Mexico, whose months with missing travel spending per person make up half or more of the period covered, is excluded, and 20 nationalities and regions are stacked. For Russia, the January–March 2024 quarter was not published, so those three months are not stacked.
Because the quarterly spending per person is spread across the months, month-to-month variation mainly reflects variation in the number of general visitors.
The first paragraph shows how the two sources were multiplied together. Even the subtraction "visitor arrivals − people granted cruise landing permits" is written into the formula, so the definition can be followed from the Chart alone.
The visitor numbers on the previous page covered 31 months (up to July 2026), but this page covers 30 months (up to June 2026). The two data sets being multiplied are published at different times. Cutting off at the shorter one is the correct treatment, and prompt item 1, "to the latest month for which estimated total spending can be calculated", ensures it.
For Russia, rather than excluding the whole key, only the three months without values are dropped. The missing values reported on the Excel parsing page — "both Russia columns are - in all 43 rows" — have carried through to here.
The third paragraph states in advance what must not be said from this Chart. You cannot look at the month-to-month ups and downs and read "spending per person rose in this month".
The stacking order and legend order are "descending order of period total". On the previous page (visitor numbers) the legend began with South Korea, Taiwan, China, the United States and Hong Kong; on this page (spending) it becomes China (中国), Taiwan (台湾), the United States (米国), South Korea (韓国) and Hong Kong (香港).
The order by number of visitors and the order by amount spent do not match. South Korea is the market that sent the most people over the 30 months, but it is fourth by amount. This difference is the theme of the analysis that follows.
Read the AI's analysis and insights
Screenshot shown in the original Japanese.
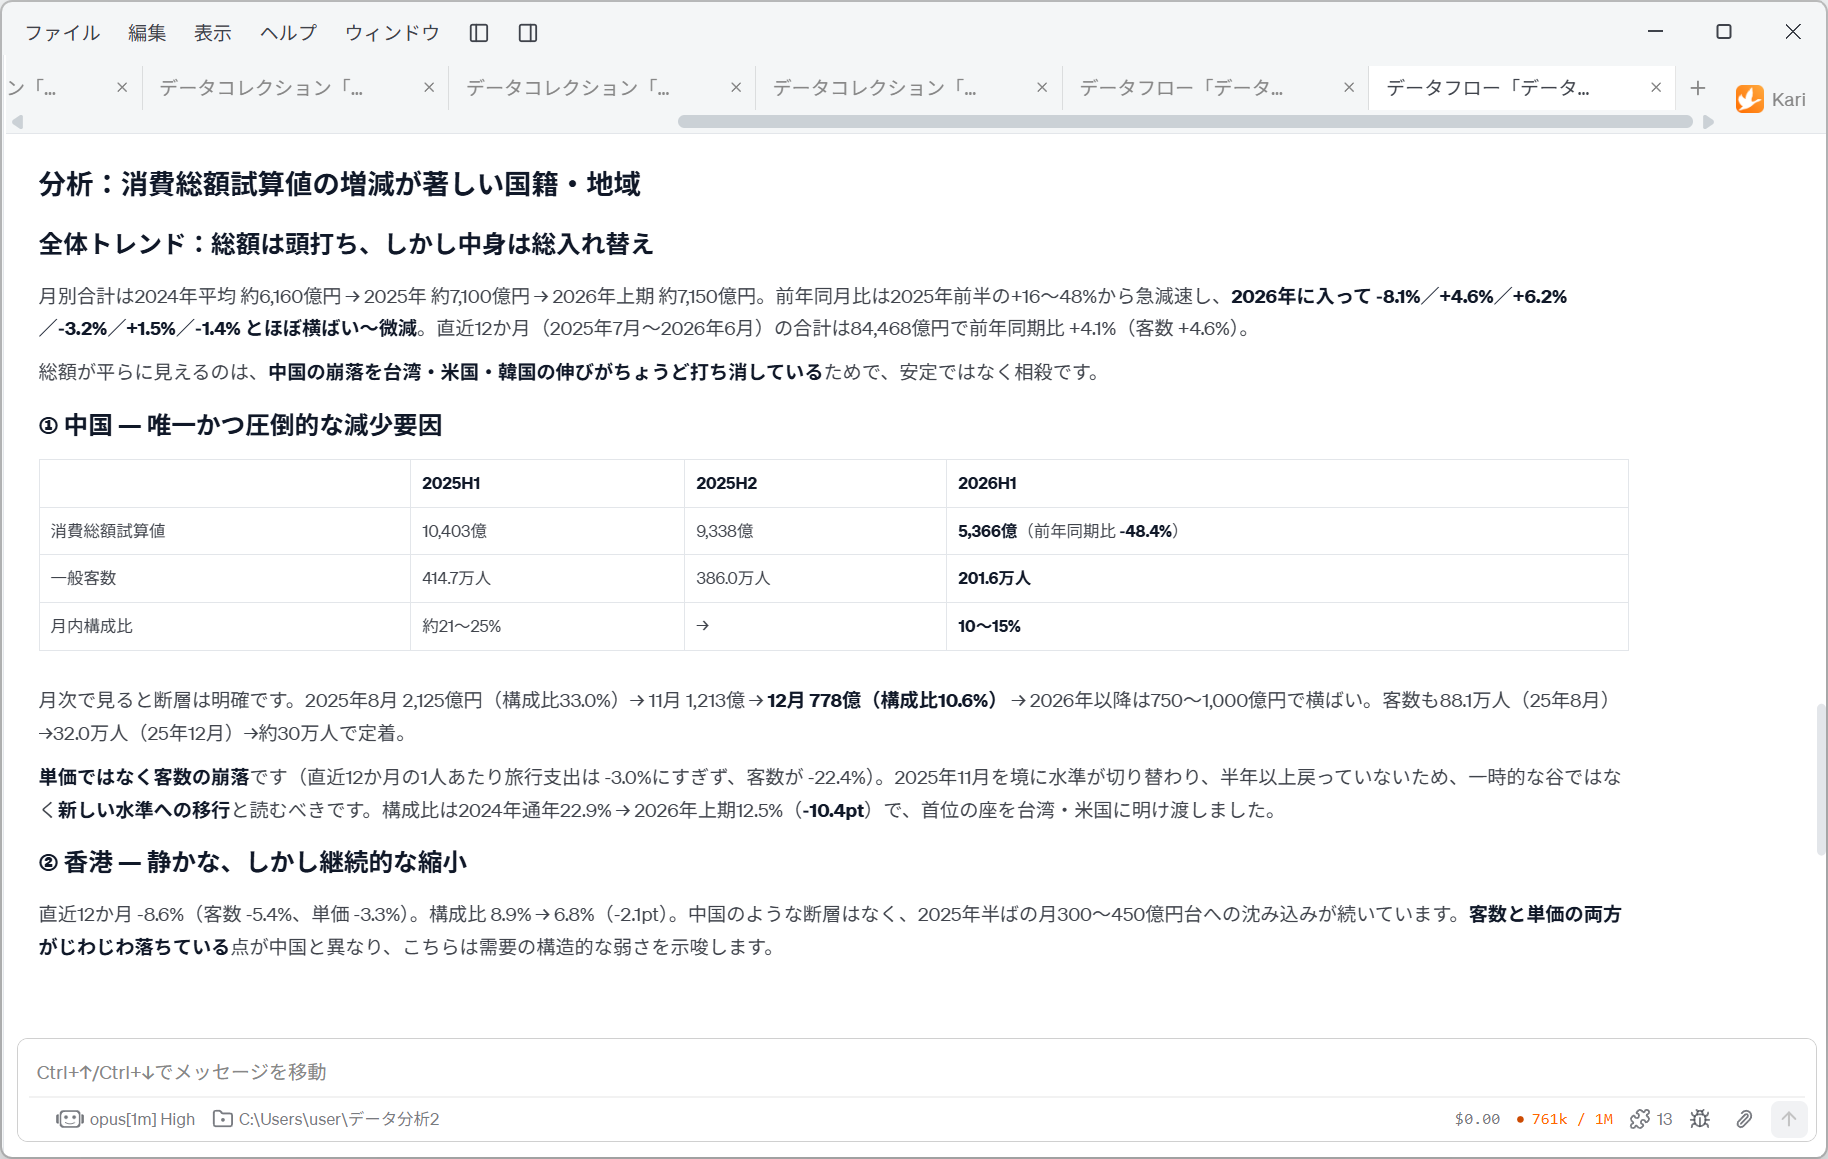
The AI's answer begins with the heading "Analysis: nationalities and regions with marked increases or decreases in estimated total spending", and is structured as the overall trend, four groups of markets, and insights.
Overall trend: the total has plateaued, but its contents have been completely reshuffled
The monthly total averaged about 616.0 billion yen in 2024 → about 710.0 billion yen in 2025 → about 715.0 billion yen in the first half of 2026. Year-on-year growth slowed sharply from +16–48% in the first half of 2025, and in 2026 has been −8.1% / +4.6% / +6.2% / −3.2% / +1.5% / −1.4%, flat to slightly down. The total for the most recent 12 months (July 2025 – June 2026) is 8,446.8 billion yen, +4.1% on the same period a year earlier (visitors +4.6%).
The total looks flat because the collapse of China is being exactly offset by growth in Taiwan, the United States and South Korea — this is not stability but offsetting.
The last sentence is the conclusion of this whole page. "Has not changed" is not the same as "nothing has happened".
Here the AI chose the most recent 12 months against the same period a year earlier as its axis of comparison. The prompt does not specify how to cut the period. There is a reason for this choice of period: 12 months contains exactly four quarters, so the spending per person spread across the months is weighted evenly, and seasonality cancels out. It is a different choice from the previous page (visitor numbers), which compared January–July cumulative totals.
Even with the same data, the picture you see changes with the period you cut out.
| How the comparison period is taken | Question it suits |
|---|---|
| Cumulative totals for a calendar year, half-year, etc. | "How does it compare with last year?" |
| Most recent 12 months against the same period a year earlier | "Where does the level stand now?" |
| A run of year-on-year changes for the same month | "When did the change happen?" |
The AI uses all three as appropriate. It showed the level with monthly averages, the turning point with the run of year-on-year changes, and the current position with the most recent 12 months. No single one of them can say all three things at once.
1. China — the sole and overwhelming cause of decline
| 2025H1 | 2025H2 | 2026H1 | |
|---|---|---|---|
| Estimated total spending | 1,040.3 billion yen | 933.8 billion yen | 536.6 billion yen (−48.4% year on year) |
| General visitors | 4.147 million | 3.860 million | 2.016 million |
| Share within the month | about 21–25% | → | 10–15% |
On a monthly basis the break is clear: August 2025, 212.5 billion yen (share 33.0%) → November, 121.3 billion → December, 77.8 billion (share 10.6%) → flat at 75.0–100.0 billion yen from 2026 onwards. Visitors likewise went from 881,000 (August 2025) → 320,000 (December 2025) → settling at about 300,000.
It is a collapse in visitors, not in spending per person (travel spending per person over the most recent 12 months is down only 3.0%, while visitors are down 22.4%). The level switched at November 2025 and has not recovered for more than six months, so it should be read not as a temporary trough but as a shift to a new level.
This is the most valuable analysis on this page. It answers not "how much it fell" but "why it fell", by splitting spending per person from visitor numbers. China's spending per person fell only 3.0%; almost all of the halving in the amount is down to people.
And the judgement "not a temporary trough but a shift to a new level" comes with the observation that it has not recovered for more than six months as its grounds. Rather than saying "it has dropped" from the shape of the graph alone, it judges whether it will recover by the length of time.
2. Hong Kong — a quiet but continuing contraction
Most recent 12 months −8.6% (visitors −5.4%, spending per person −3.3%). Share 8.9% → 6.8% (−2.1pt). There is no break like China's; the sinking to 30.0–45.0 billion yen a month since mid-2025 continues. Unlike China, both visitors and spending per person are slipping gradually, which suggests a structural weakness in demand.
The thing to read here is that China and Hong Kong are set side by side and contrasted. Both are shrinking, but China "fell like a step at a particular month", while Hong Kong "keeps falling gently". Even with the same "decrease", the measures to take differ.
In the stacked Chart, both just look like "the blue band has got thinner". The difference in shape cannot be seen without going back to the numbers.
3. Taiwan and the United States — the two pillars that filled China's gap
Screenshot shown in the original Japanese.
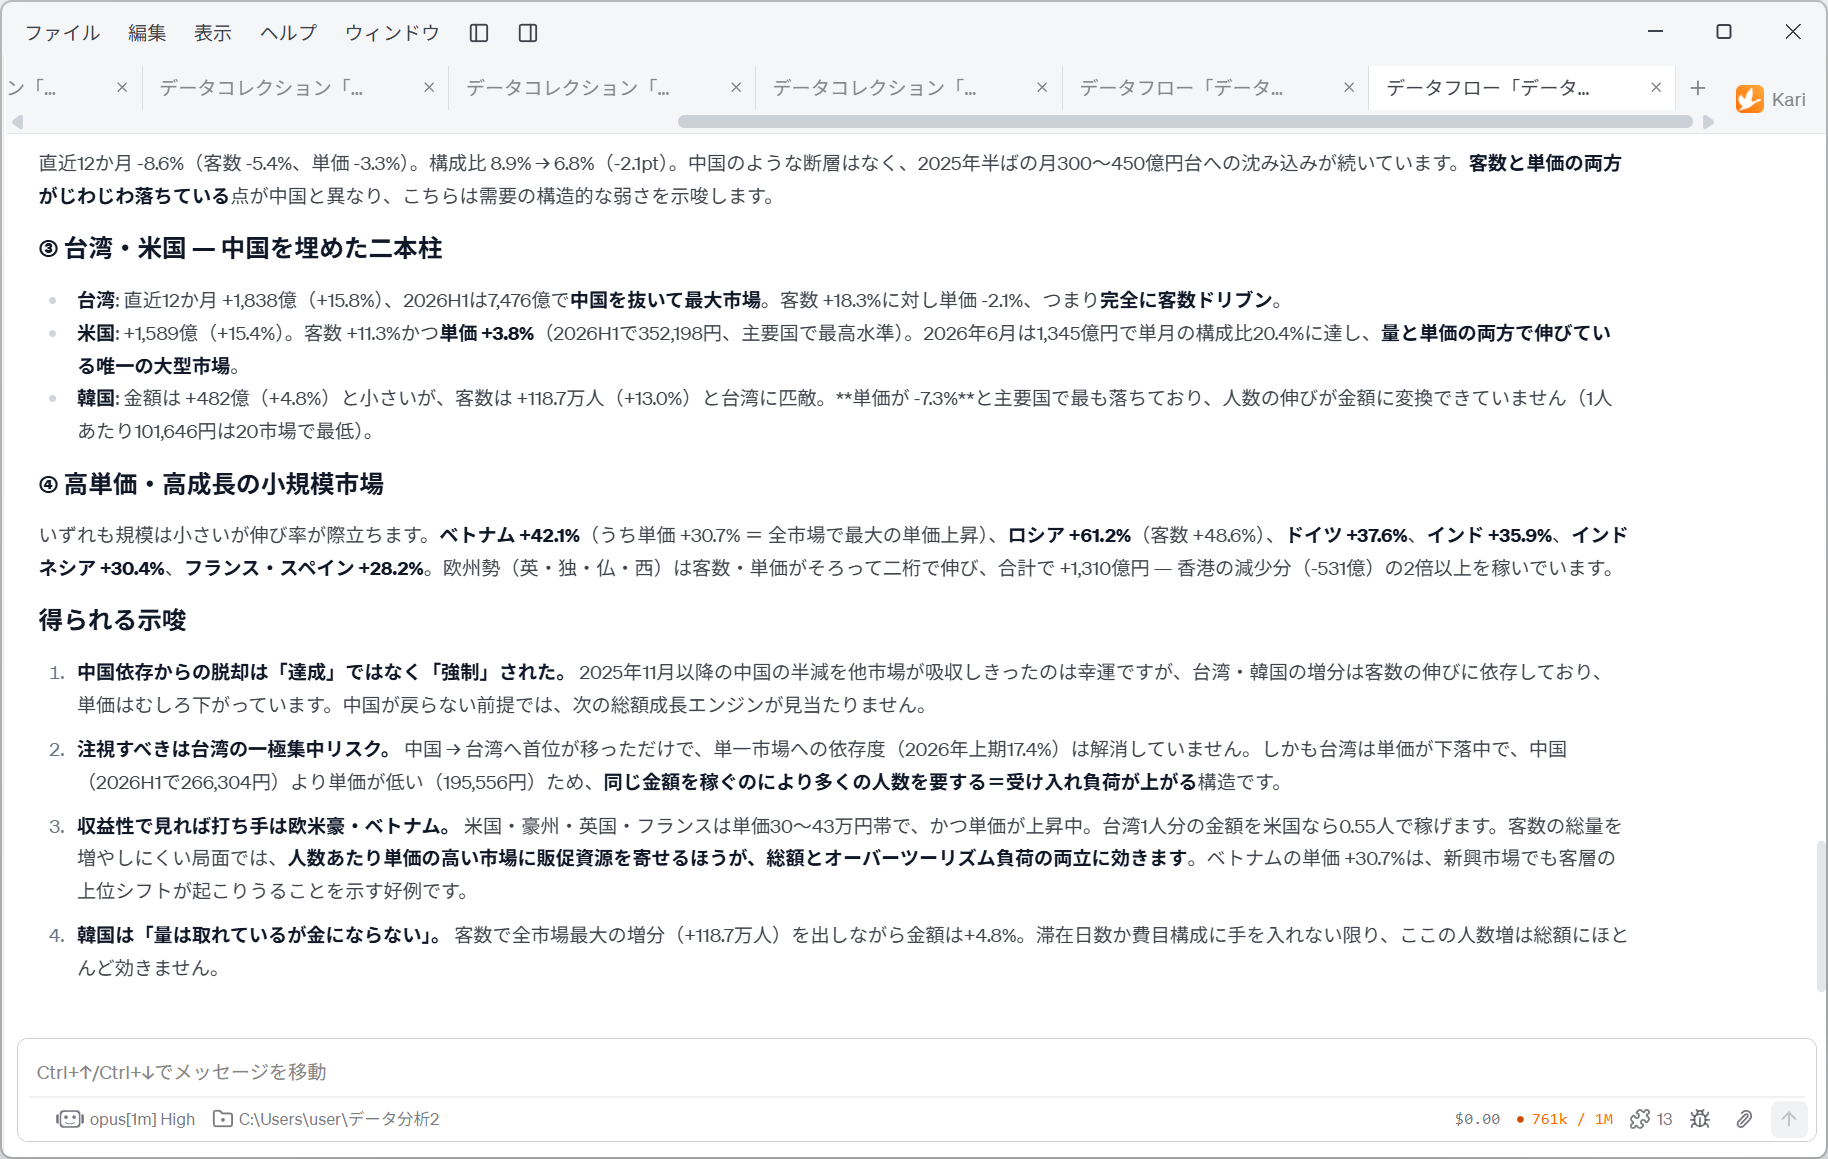
- Taiwan: most recent 12 months +183.8 billion (+15.8%); in 2026H1, at 747.6 billion, it overtook China as the largest market. Visitors +18.3% against spending per person −2.1%; in other words, entirely visitor-driven.
- United States: +158.9 billion (+15.4%). Visitors +11.3% and spending per person +3.8% (352,198 yen in 2026H1, the highest level among the major countries). In June 2026 it reached 134.5 billion yen, a single-month share of 20.4% — the only large market growing in both volume and spending per person.
- South Korea: the amount is small at +48.2 billion (+4.8%), but visitors are +1.187 million (+13.0%), on a par with Taiwan. Spending per person is −7.3%, the largest fall among the major countries, and the growth in people is not being converted into money (101,646 yen per person is the lowest of the 20 markets).
The conclusion of the previous page is revised here. Looking at visitor numbers alone, South Korea was the largest market with the largest growth. In spending, however, it stays at +4.8%, and its spending per person has actually fallen.
All three markets are growing, but the quality of their growth differs. Only the United States grows in "both volume and spending per person". Lump them together under the same label of "growth market" and this difference disappears.
4. Small markets with high spending per person and high growth
All are small in scale but stand out for their growth rates: Vietnam +42.1% (of which spending per person +30.7% = the largest rise in spending per person of any market), Russia +61.2% (visitors +48.6%), Germany +37.6%, India +35.9%, Indonesia +30.4%, France and Spain +28.2%. The European group (UK, Germany, France, Spain) has grown by double digits in both visitors and spending per person, together +131.0 billion yen — more than twice Hong Kong's decrease (−53.1 billion).
Rather than stopping at listing the small markets individually, the AI adds the comparison that together they come to more than twice Hong Kong's decrease. This is where it refutes for itself the conclusion that "they are small, so they can be ignored".
Insights drawn out
- The move away from dependence on China was not "achieved" but "forced". It was fortunate that other markets fully absorbed the halving of China from November 2025 onwards, but the increases from Taiwan and South Korea depend on visitor growth, and their spending per person has actually fallen. Assuming China does not come back, there is no visible engine for the next round of growth in the total.
- The risk to watch is concentration on Taiwan. The top spot has merely moved from China to Taiwan; dependence on a single market (17.4% in 2026H1) has not been resolved. Moreover, Taiwan's spending per person (195,556 yen) is lower than China's (266,304 yen), so the structure is one where earning the same amount takes more people = a heavier load on receiving capacity.
- In terms of profitability, the moves to make are in Europe, North America, Australia and Vietnam. The United States, Australia, the UK and France are in the 300,000–430,000 yen band for spending per person, and it is rising. What one Taiwanese visitor spends, 0.55 American visitors can bring in.
- South Korea "brings in volume but not money". Despite the largest increase in visitors of any market (+1.187 million), the amount is up only 4.8%. Unless something is done about length of stay or the mix of expense items, growth in visitor numbers will barely affect the total.
Insight 2 is the most practical point on this page. "The top spot moved from China to Taiwan" does not mean that dependence has fallen. What is more, the market that took its place has lower spending per person, so the number of people needed to earn the same revenue increases. For accommodation and transport operators, this means that even with the same revenue, the load increases.
The restatement in insight 3, "what one Taiwanese visitor spends, 0.55 American visitors can bring in", is also effective. Turning a difference in spending per person into a ratio of people leads directly to decisions on where to put promotional resources.
Note that the conclusion ends not with "spending was flat" but with what to do next.
Human-in-the-loop points
Do not leave everything to the AI. Check the following yourself.
-
Check the reported figures
In this example, nearly all the main figures could be reproduced. The most recent 12 months' 8,446.8 billion yen and +4.1% year on year, China's 212.5 billion yen in August 2025 → 77.8 billion yen in December, Taiwan's +183.8 billion (+15.8%), the United States' 134.5 billion yen in June 2026, and so on, all match the values in the Dataflow.However, one figure does not reproduce. The statement that "the European group (UK, Germany, France, Spain) together +131.0 billion yen" comes to +150.9 billion yen when calculated on the same most-recent-12-months basis. The conclusion ("more than twice Hong Kong's decrease of −53.1 billion") holds either way, but the total itself needs to be checked again. Even when the reasoning in the text holds together, the figures attached to it may not add up.
-
Check that missing months are not included in the comparison period
For Russia, the three months of January–March 2024 are not stacked. The "most recent 12 months (July 2025 – June 2026) vs the same period a year earlier" in this example does not include these three months, so it is not affected, but they do matter in comparisons that include the first half of 2024. You end up comparing three months with six, and the apparent growth is overstated. Each time, check that the comparison period does not overlap the missing period. -
Month-to-month variation reflects only the number of general visitors
Travel spending per person is a quarterly value copied to each month. The month-to-month ups and downs in the Chart are explained by changes in headcount alone. You cannot read "spending per person rose in this month". -
Be aware that you are multiplying data published at different times
The number of general visitors runs to July, the consumption survey to June. In this example the series was cut off at the shorter one, but always check that the cut-off has been made. If the series is extended, the most recent figures will be values in which only the headcount has moved while the spending per person stays at an old figure. -
Look at "visitors" and "per person" separately
Over the most recent 12 months, South Korea's visitors grew +13.0%, on a par with Taiwan, but because spending per person fell 7.3%, the amount rose only 4.8%. In Hong Kong, both visitors and spending per person fell. The ranking by visitors and the ranking by spending do not match. -
Do not read "flat" as "no change"
The market as a whole is +4.1% over the most recent 12 months, but inside that, China moved by −481.2 billion yen and Taiwan and the United States together by +342.7 billion yen. It is a flatness that results from large changes cancelling each other out. If you look only at the total, you will miss the reshuffling of the mix. -
Distinguish the ranking over the whole period from the most recent ranking
The stacking order in the Chart is by 30-month total, so China still comes first. But in the first half of 2026, Taiwan is the largest market. When discussing the current size of markets, look at the most recent values, not the total over the period. -
Check where the comparison period was taken
In this example the AI made "most recent 12 months vs the same period a year earlier" its main axis. This is a different period from the "January–July cumulative" on the previous page (visitor numbers). A different period gives different figures. When putting the figures from the two pages side by side, recalculate them over the same period. -
Do not treat the estimates as published figures
They are estimates obtained by multiplying the spending per person from a sample survey by an approximated headcount. They do not match the spending published by the Japan Tourism Agency. If you use them externally, always state the method of calculation and the assumptions alongside them. -
Check the extent of exclusions and missing data
Mexico is excluded as a whole key, while Russia is missing only the three months of January–March 2024. Exclusion by key and missing data by period are mixed together.
The way the comparison periods are taken, the markets focused on, and the very angle of the analysis vary with the LLM used. Even with the same prompt, the AI may sometimes perform a factor decomposition and at other times summarize the result as a contrast between groups of markets. Always work out over which period, and how, a figure was compared before quoting a conclusion.
References
The data analyzed on this page are the three public data sets retrieved, parsed and joined on the preceding pages. Screenshots are reproduced as quotations with the source stated. The estimates, interpretations of market trends and insights calculated by the AI were generated by GotoAI as an example of Kari's operation; they were not created or published by the Japan Tourism Agency, the Japan National Tourism Organization or the Ministry of Justice.
Consumption trend data
- Material: Consumption Trend Survey for Foreigners Visiting Japan (「インバウンド消費動向調査」, formerly 「訪日外国人消費動向調査」), 「参考2 国籍・地域別 費目別1人1回当たり旅行消費単価(パッケージツアー参加費内訳含む)」 (Reference 2: travel spending per person per trip by nationality/region and expense item, including the breakdown of package tour fees)
- Provider: Japan Tourism Agency (Ministry of Land, Infrastructure, Transport and Tourism)
- URL: https://www.mlit.go.jp/kankocho/tokei_hakusyo/gaikokujinshohidoko.html
- Accessed: October 15, 2026
- Terms of use: In accordance with that website's terms of use. Source: Ministry of Land, Infrastructure, Transport and Tourism website (URL above).
Visitor arrivals data
- Material: JNTO's statistics on visitor arrivals (「訪日外客統計」), 「国籍/月別 訪日外客数」 (visitor arrivals by nationality and month; time-series table)
- Provider: Japan National Tourism Organization (JNTO)
- URL: https://www.jnto.go.jp/statistics/data/visitors-statistics/
- Accessed: October 15, 2026
- Terms of use: In accordance with JNTO's rules, used with "Japan National Tourism Organization (JNTO)" (「日本政府観光局(JNTO)」) stated as the source.
Cruise passenger data
- Material: Immigration control statistics (「出入国管理統計」), 「港別 船舶観光上陸許可を受けた外国人の国籍・地域」 (nationality/region of foreign nationals granted cruise landing permits, by port; monthly table)
- Provider: Ministry of Justice (Immigration Services Agency of Japan) / Portal Site of Official Statistics of Japan (e-Stat)
- URL: https://www.e-stat.go.jp/stat-search/files?toukei=00250011
- Accessed: October 16, 2026
- Terms of use: In accordance with that site's terms of use. Source: Ministry of Justice, 「出入国管理統計」.
- The external information quoted on this site is provided to illustrate examples of using Kari. This site does not guarantee the accuracy or currency of that information. Quoted sources may be changed or removed without notice.
- The AI output shown on this site was actually obtained in the stated verification environment. However, this site does not guarantee the accuracy or usefulness of that output. AI output varies with the LLM used, its settings, and from one run to the next.
- This use case is an illustration of how Kari works, and the figures it produces may differ from those published by the Japan Tourism Agency.
- Total spending on this page is an "estimate". It is calculated by multiplying the travel spending per person from the consumption survey, a sample survey, by the number of general visitors obtained as "visitor arrivals − cruise landing permits", and it does not match the spending published by the Japan Tourism Agency.
- Travel spending per person is a quarterly value copied to each month. Month-to-month variation reflects only the variation in the number of general visitors.
- The interpretations of market trends and the insights shown on this page were generated by the AI from this data. This site has not verified their causal relationships or background. If you use them for business decisions, always check them against the primary sources and other sources of information.
- Shares and rates of increase or decrease are based on the total for the 20 nationalities and regions analyzed. They are not relative to all visitor arrivals.
- The 2026 data is a partial period, up to June. Comparisons between years require aligning the periods.
- Screenshots were taken with the version of Kari current at the time of writing. The display may differ in your version.
- The organizations and bodies quoted have no affiliation with, and do not endorse, this site or Kari.