Retrieve the data needed for the analysis from the web pages of the Japan Tourism Agency, JNTO and the Ministry of Justice
Copyright © 2026GotoAI Inc.Based on the goose project
The steps in this use case were verified in the following environment.
- Kari: version 0.7.3, Windows
- AI provider: Anthropic Claude subscription
- Model: Claude Opus 5.5 High
Preparing the work
On this page you retrieve separate data from three public bodies.
| Japan Tourism Agency (観光庁) | JNTO (Japan National Tourism Organization) | Ministry of Justice (Immigration Services Agency of Japan) | |
|---|---|---|---|
| Data | Consumption Trend Survey for Foreigners Visiting Japan (「インバウンド消費動向調査」) | JNTO's statistics on visitor arrivals (「訪日外客統計」) | Immigration control statistics (「出入国管理統計」) (cruise landing permits, 「船舶観光上陸許可」) |
| What you want to know | How much each visitor spent | How many visitors came | How many of them were cruise passengers |
| Published granularity | Quarterly | Monthly | Monthly |
| File layout | A separate file for each quarter (10 files) | One file with a sheet per year (24 sheets) | A separate file for each month |
The third is needed because the spending per person in the consumption survey and the visitor numbers in the visitor arrival statistics do not refer to the same population.
The travel spending per person that the Japan Tourism Agency publishes by nationality and region is for "general visitors", excluding cruise passengers. JNTO's visitor arrivals, on the other hand, include cruise passengers. Multiplying the two as they are overstates total spending.
General visitors = JNTO visitor arrivals − cruise landing permits (cruise passengers)
The number of cruise passengers is taken from the Ministry of Justice's immigration control statistics. The Japan Tourism Agency also notes that it uses these statistics to estimate the number of cruise passengers.
The total spending calculated in this use case is an estimate, obtained as an example of Kari in operation. It does not exactly match the figures published by the Japan Tourism Agency. The aim is to show the broad outline of the method.
-
Decide on the working folder where files will be saved. Right-click Explorer in the left navigation panel and specify it from Open Folder…. This example uses
データ分析2(Data Analysis 2). -
Open a chat session. Give the three instructions one after another in the same session.
The Japan Tourism Agency's page for the Consumption Trend Survey for Foreigners Visiting Japan is also covered in Automating data download and file renaming. There, the goal was to save the files under prescribed file names.
This page goes one step further and hands over the work up to merging everything into a single file usable for analysis. Even with the same source, the shape of the instruction changes with what you are going to do next.
Instruct the AI
- To download the Consumption Trend Survey data from the Japan Tourism Agency's web page, instruct the AI as follows. The prompts below are English renderings of the Japanese prompts shown in the screenshots; sheet, file, column and value labels are quoted as they appear in the Japanese source data.
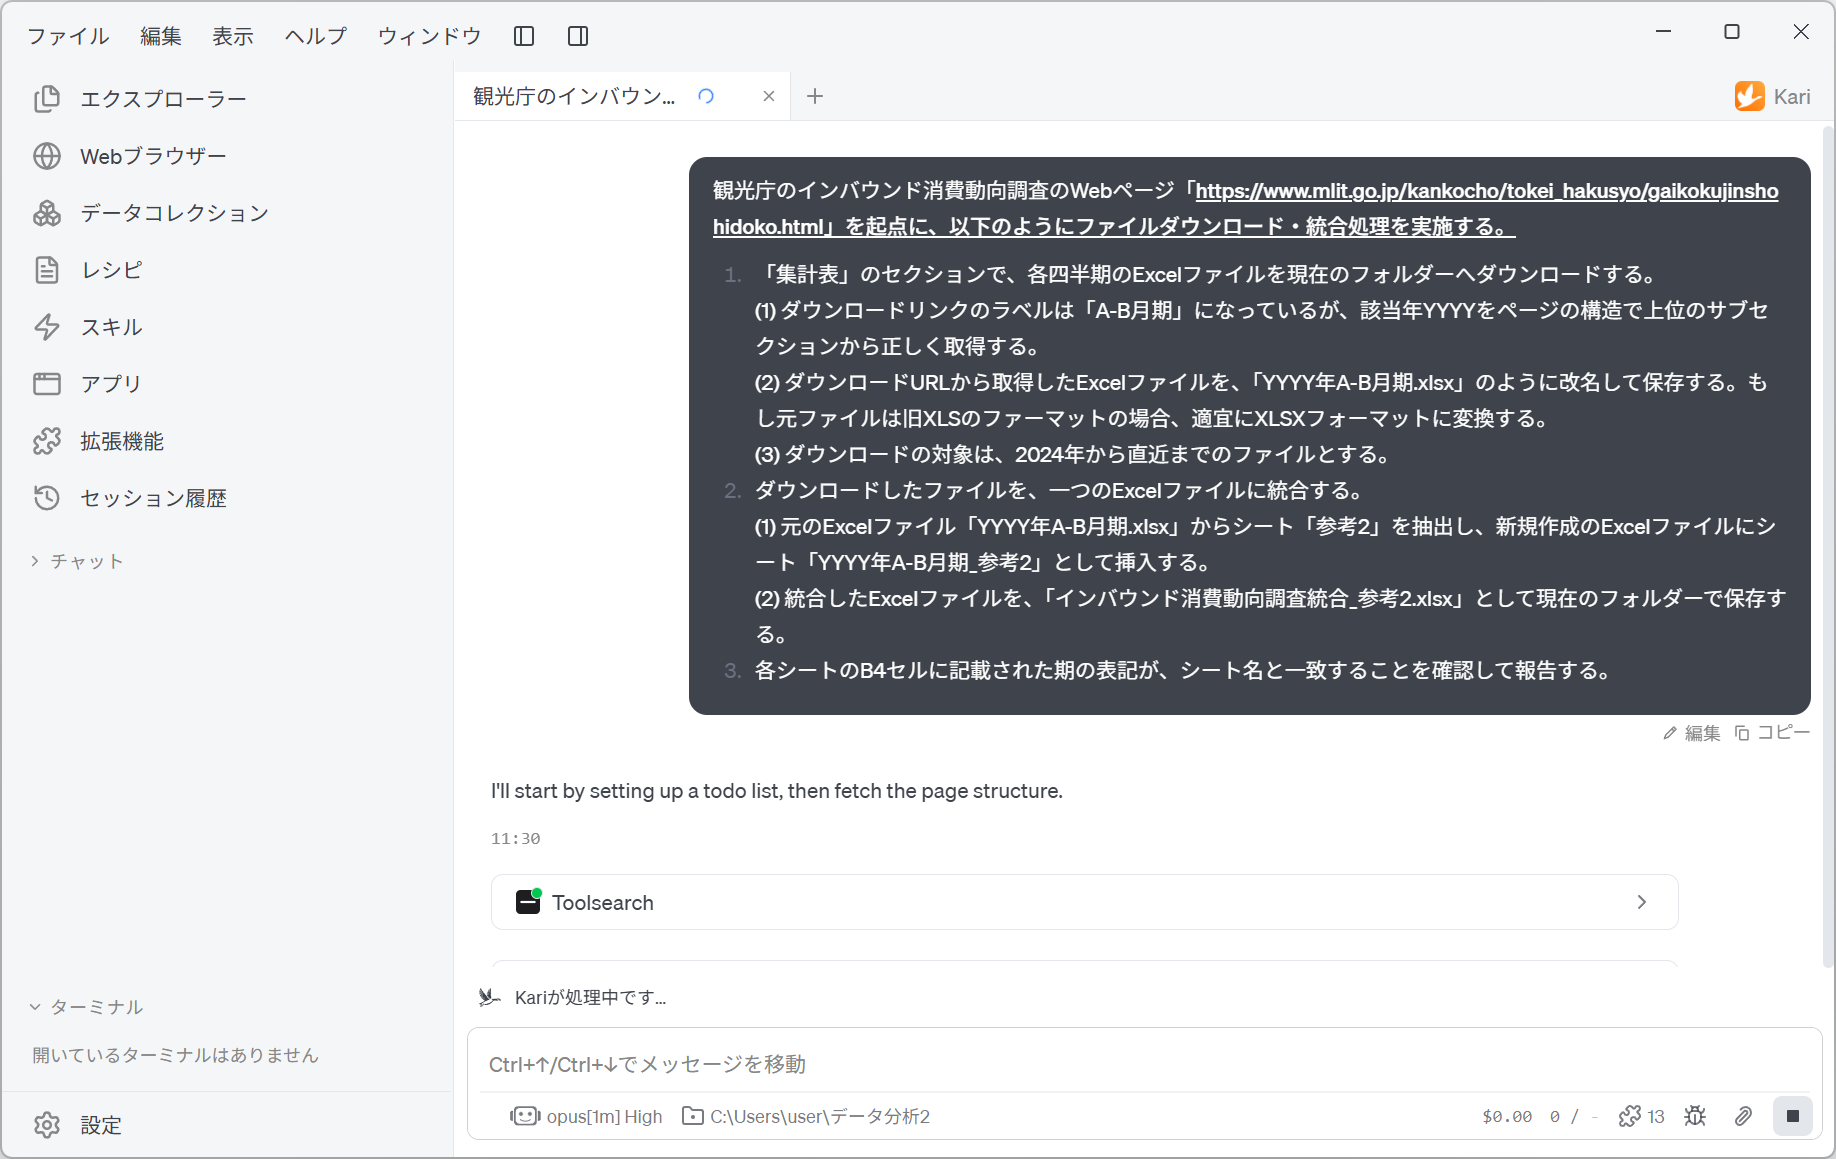
Starting from the Japan Tourism Agency's web page for the Consumption Trend Survey for Foreigners Visiting Japan, "https://www.mlit.go.jp/kankocho/tokei_hakusyo/gaikokujinshohidoko.html", download and merge files as follows.

1. In the 「集計表」 (tabulations) section, download each quarter's Excel file to the current folder.
  (1) The download link labels read 「A-B月期」 (A–B quarter); take the corresponding year YYYY correctly from the higher-level subsection in the page structure.
  (2) Save the Excel file obtained from the download URL under a new name such as 「YYYY年A-B月期.xlsx」. If the original file is in the old XLS format, convert it to XLSX format as appropriate.
  (3) Download the files from 2024 up to the most recent.
2. Merge the downloaded files into a single Excel file.
  (1) From each original Excel file 「YYYY年A-B月期.xlsx」, extract the sheet 「参考2」 and insert it into a newly created Excel file as the sheet 「YYYY年A-B月期_参考2」.
  (2) Save the merged Excel file in the current folder as 「インバウンド消費動向調査統合_参考2.xlsx」.
3. Check that the period label written in cell B4 of each sheet matches the sheet name, and report the result.
Screenshot shown in the original Japanese.
The same workbook has 37 sheets, including 表2-1, 表3-1, 参考1 and 参考2, and the result changes depending on which one you use.
| Sheet | Content |
|---|---|
表2-1 (Table 2-1) | Purchase rate and spending per purchaser (the average amount among those who bought) by expense item |
表3-1 (Table 3-1) | Travel spending per person (excluding the domestic portion of package tour fees) |
参考2 (Reference 2) | Travel spending per person per trip by expense item (including the breakdown of package tour fees) |
The total spending that the Japan Tourism Agency publishes rests on the 参考2 series. Multiplying the purchase rate by the spending per purchaser in 表2-1 and summing gives the same figure as 表3-1, but because the domestic portion of tour fees drops out, it comes out about 10% lower.
The values in 参考2 are spending per person averaged over all visitors. The purchase rate is already built in, so multiplying by the purchase rate as in 表2-1 would count it twice.
- Next, to download the visitor arrival data from JNTO's web page, instruct the AI as follows.
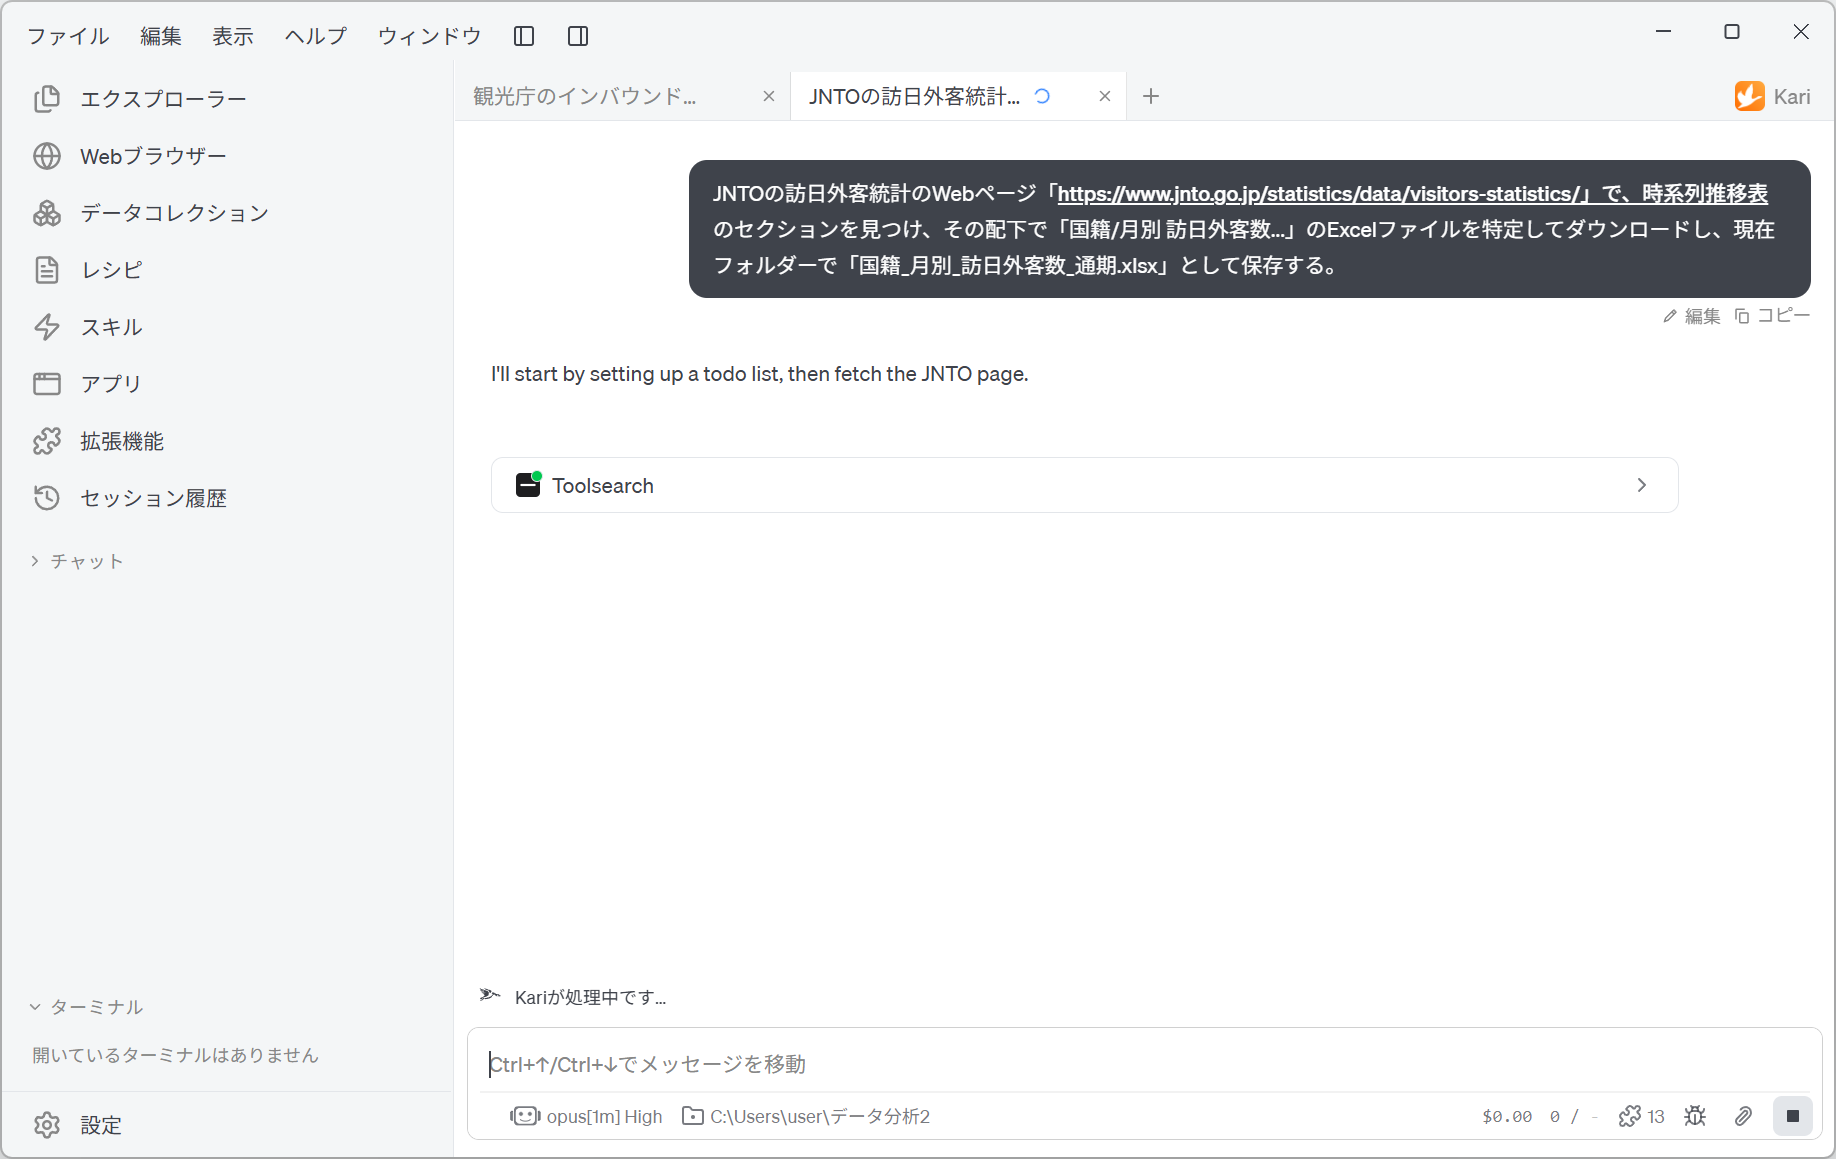
On JNTO's web page for the statistics on visitor arrivals, "https://www.jnto.go.jp/statistics/data/visitors-statistics/", find the 「時系列推移表」 (time-series tables)
section, identify and download the Excel file 「国籍/月別 訪日外客数...」 (visitor arrivals by nationality/month) under it, and save it in the current folder as 「国籍_月別_訪日外客数_通期.xlsx」.
Screenshot shown in the original Japanese.
- Finally, instruct the AI to retrieve the monthly data on cruise landing permits (cruise passengers) from the immigration control statistics of the Ministry of Justice (Immigration Services Agency of Japan).
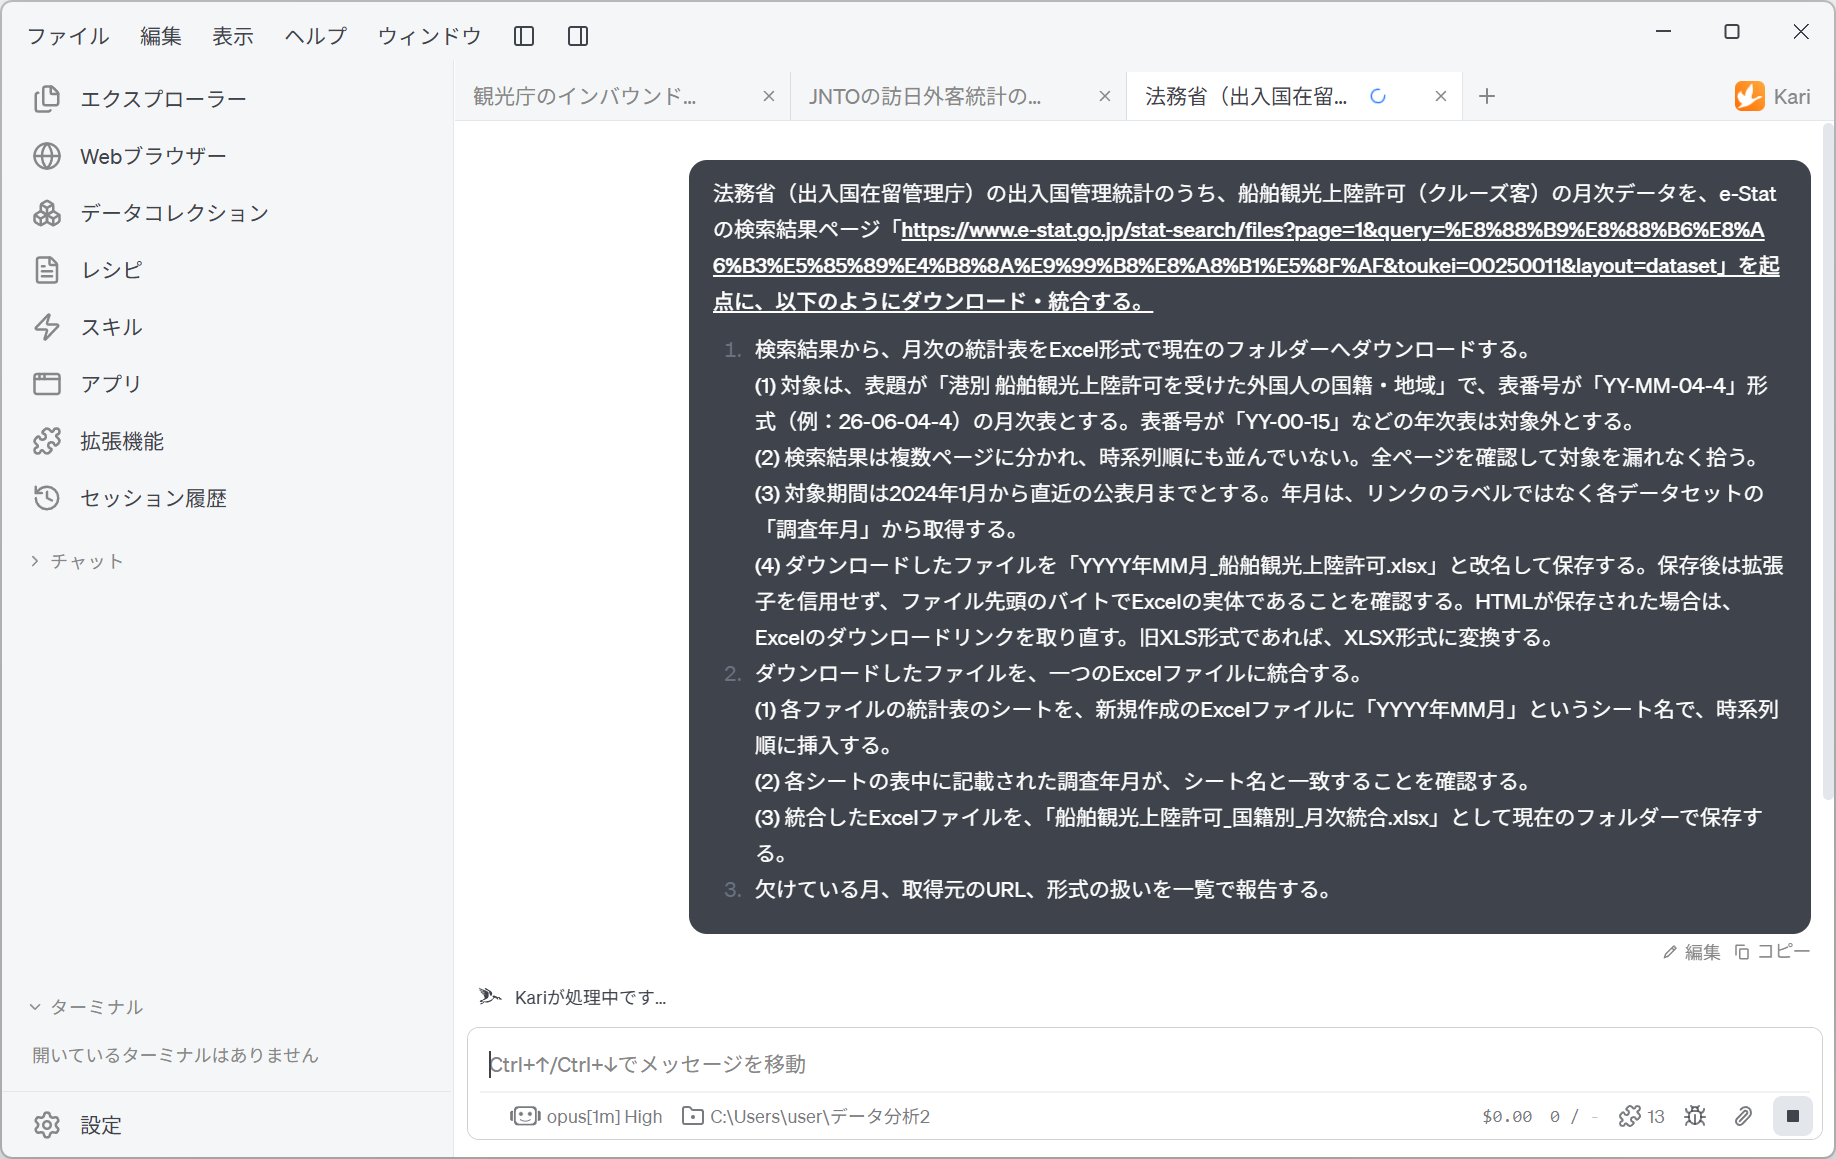
From the immigration control statistics of the Ministry of Justice (Immigration Services Agency of Japan), download and merge the monthly data on cruise landing permits (cruise passengers) as follows, starting from the e-Stat search results page "https://www.e-stat.go.jp/stat-search/files?page=1&query=%E8%88%B9%E8%88%B6%E8%A6%B3%E5%85%89%E4%B8%8A%E9%99%B8%E8%A8%B1%E5%8F%AF&toukei=00250011&layout=dataset".

1. From the search results, download the monthly statistical tables in Excel format to the current folder.
  (1) The targets are the monthly tables titled 「港別 船舶観光上陸許可を受けた外国人の国籍・地域」 (nationality and region of foreign nationals granted cruise landing permits, by port), with a table number of the form 「YY-MM-04-4」 (e.g. 26-06-04-4). Annual tables with table numbers such as 「YY-00-15」 are excluded.
  (2) The search results are split across several pages and are not in chronological order. Check every page and pick up all the targets without omission.
  (3) The period covered is January 2024 to the most recently published month. Take the year and month from each data set's 「調査年月」 (survey year and month), not from the link label.
  (4) Save each downloaded file under the new name 「YYYY年MM月_船舶観光上陸許可.xlsx」. After saving, do not trust the extension; check from the leading bytes of the file that it really is Excel. If HTML has been saved, fetch the Excel download link again. If it is in the old XLS format, convert it to XLSX format.
2. Merge the downloaded files into a single Excel file.
  (1) Insert the statistical table sheet of each file into a newly created Excel file, named 「YYYY年MM月」, in chronological order.
  (2) Check that the survey year and month written in the table on each sheet matches the sheet name.
  (3) Save the merged Excel file in the current folder as 「船舶観光上陸許可_国籍別_月次統合.xlsx」.
3. Report, as a list, any missing months, the source URLs, and how the formats were handled.
Screenshot shown in the original Japanese.
The way these three instructions are put together has the following points.
| Block of the instruction | Purpose |
|---|---|
| Japan Tourism Agency 1-(1) Take the year from the page structure | The link labels do not contain the year. Links reading only 「4-6月期」 (April–June quarter) are lined up under year headings. Unless you say where to take the year from, years get mixed up. |
| Japan Tourism Agency 1-(2) Convert the old format | The Japan Tourism Agency's files mix .xls and .xlsx depending on the year. The instruction has the AI align the format so the files can be handled in the later merge. |
| Japan Tourism Agency 1-(3) Limit the period covered | The range is set as "from 2024 up to the most recent". Taking the whole period adds more files in old formats and complicates the merge. |
| Japan Tourism Agency 2-(1) Sheet naming rule | The sheet names in the merged file are specified as 「YYYY年A-B月期_参考2」. Without settling the names in advance, you can no longer tell which sheet belongs to which period. |
| Japan Tourism Agency 3. Check against cell B4 | Because the year is inferred from the page structure, the AI is made to confirm it from the file contents. |
| JNTO: Identify the section | The hierarchy is specified: "find the time-series tables section, and under it". If the AI searches the whole page, it picks up a different table. |
| JNTO: Identify the Excel file | The same table is published in both Excel and PDF. The instruction says explicitly "identify the Excel file". |
| Ministry of Justice 1-(1) Narrow by table number | Under the same title, both monthly and annual tables appear. The AI is made to tell them apart by the form of the table number (YY-MM-04-4 and YY-00-15). |
| Ministry of Justice 1-(2) Check every page | e-Stat's search results are split across several pages and not in chronological order. Unless you state "check every page and pick up all the targets without omission", some will be missed. |
| Ministry of Justice 1-(3) Year and month from the survey year and month | Here too, the AI is made to take the year and month from an attribute of the data, not from the label. The same idea as with the Japan Tourism Agency. |
| Ministry of Justice 3. Report missing months | Because 31 monthly files are collected, this makes gaps detectable. Even with one month missing, the total looks plausible at first glance. |
Do not let the AI decide the year from the link label alone. On the Japan Tourism Agency's page, the labels 「1-3月期」 (January–March quarter) and 「4-6月期」 (April–June quarter) appear again and again under each year's heading. Looking only at the labels, you cannot tell which year they belong to. Specifying where to look — "from the higher-level subsection in the page structure" — is the key to this instruction.
The same applies on the e-Stat side. The AI is made to take the year and month from the data set's 「調査年月」 (survey year and month), not from the link label.
Check the AI's work in the chat session
- First, the result for the consumption survey. The list of downloaded files and the result of the merge are reported.
Screenshot shown in the original Japanese.
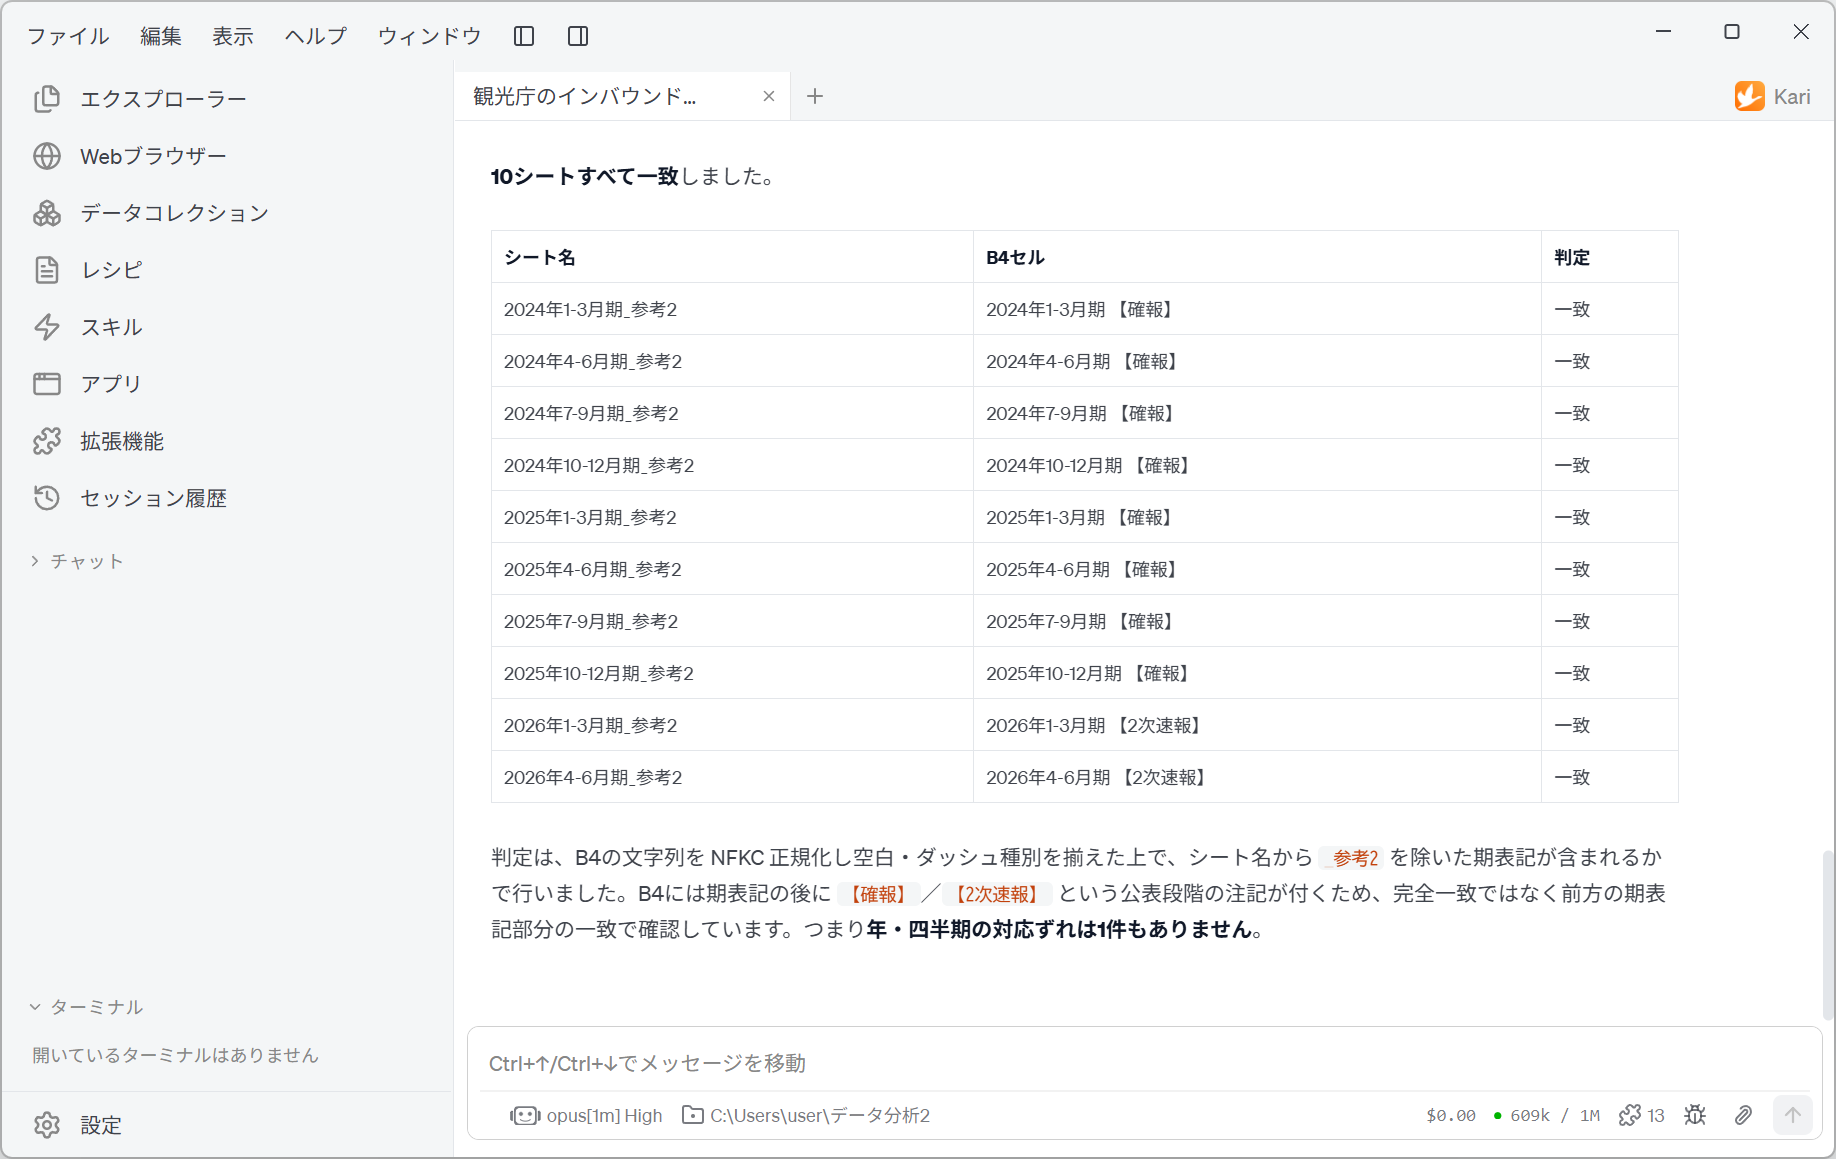
インバウンド消費動向調査統合_参考2.xlsx holds 10 sheets, from 2024年1-3月期_参考2 to 2026年4-6月期_参考2, in chronological order.
The screen shows the result of the check against cell B4 requested in instruction 3. The sheet names and the period labels written inside the sheets were compared one by one, and all 10 sheets are reported as matching.
For the check, I NFKC-normalized the B4 string, unified whitespace and dash variants, and then tested whether it contains the period label from the sheet name with
_参考2removed. Because B4 carries a publication-stage note such as【確報】/【2次速報】after the period label, I checked for a match on the leading period-label part rather than an exact match. In other words, there is not a single mismatch of year or quarter.
The part of instruction 1-(1) that said "take the year from the page structure" has been verified against the file contents. The reading of the page has been confirmed correct by a separate route.
Note also that the AI explains how it made the check. It saw that an exact match would not work, so it normalized the strings and then compared on a prefix match. Because it writes not just the conclusion "they match" but how it compared them, a person can judge whether the check was sound.
The 参考2 sheets have 48 columns (21 nationality and region categories) for 2024 and 2025, and 54 columns (24 categories) for 2026. This is because Mexico, the Nordic countries and the Middle East were added from 2026.
When comparing across periods, you need to match columns by header name, not by column position.
- Next, the result for JNTO. The AI explains how it reached the target file.
Screenshot shown in the original Japanese.
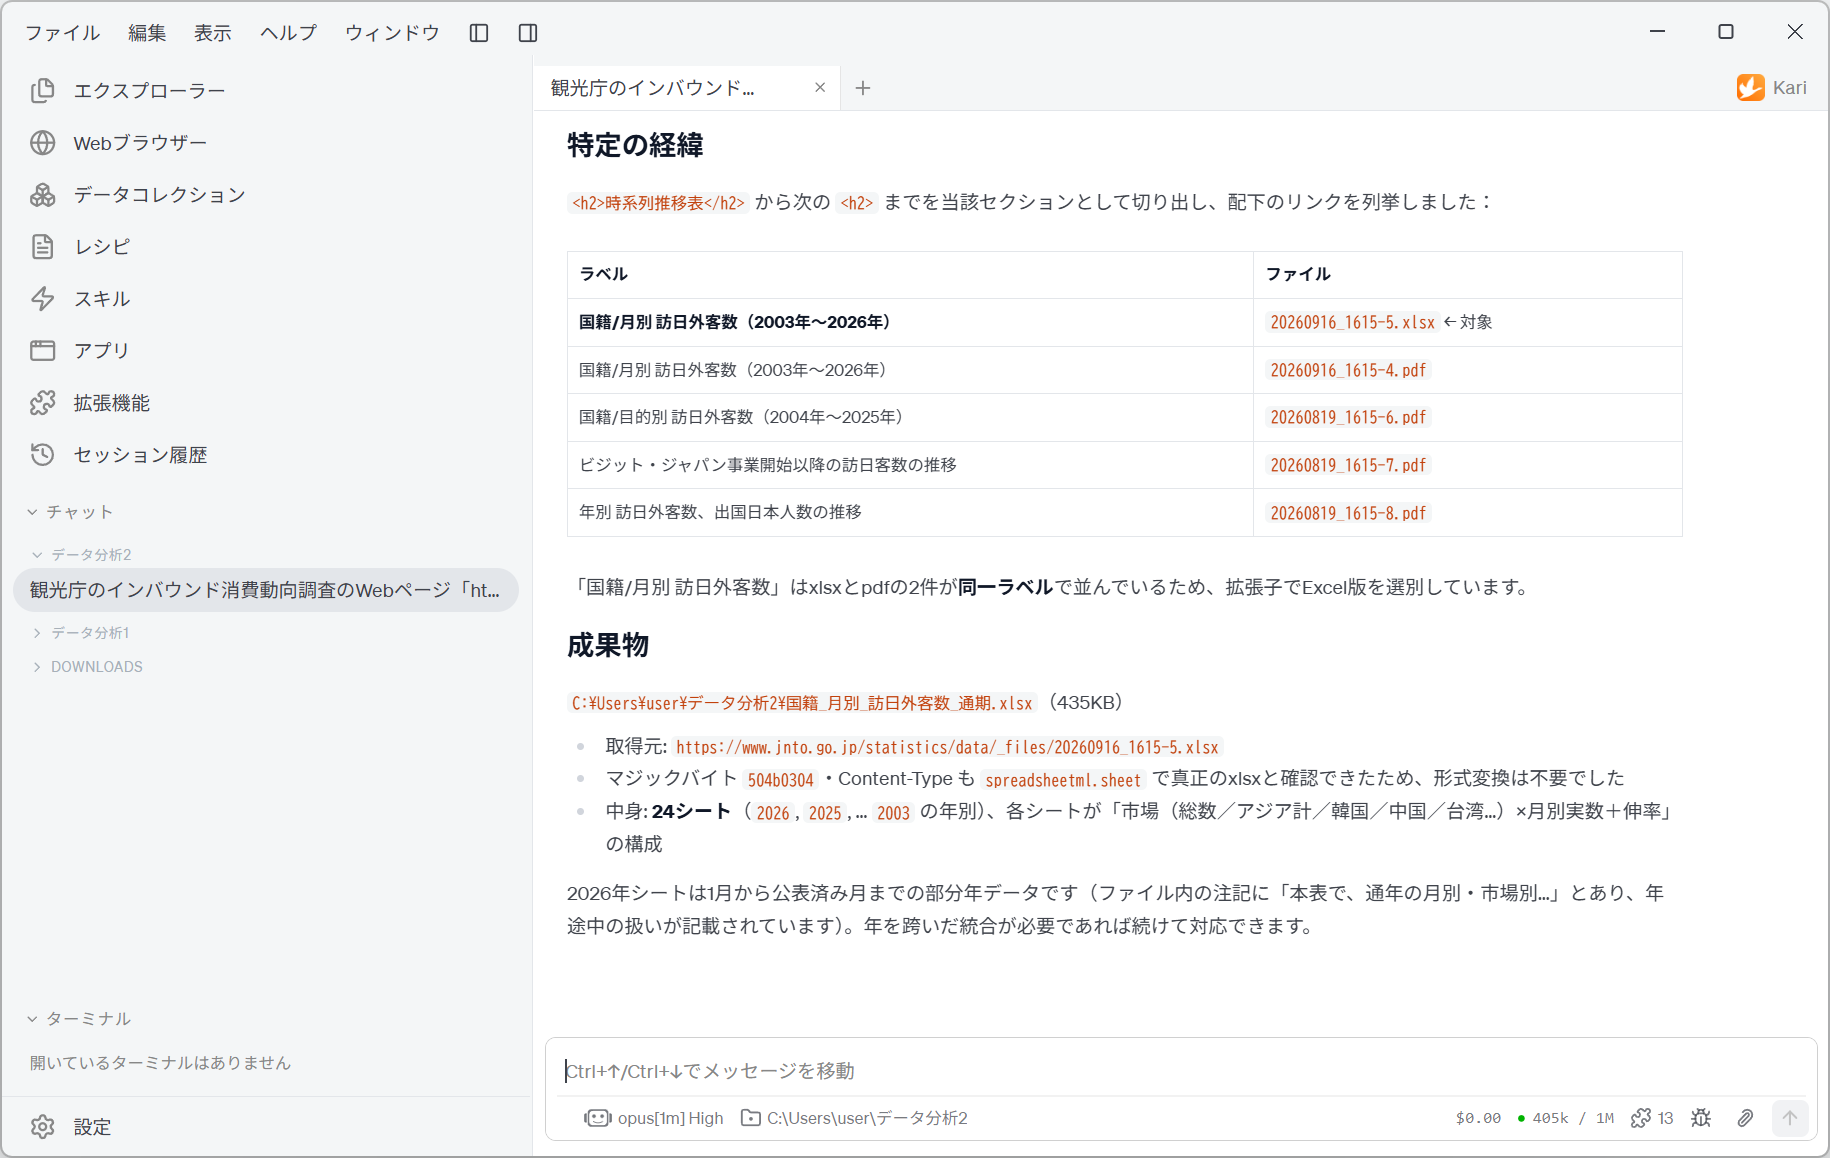
I cut out everything from
<h2>時系列推移表</h2>to the next<h2>as the section in question and listed the links under it
The extracted section has five links, and the first two have exactly the same label.
| Label | File |
|---|---|
| 国籍/月別 訪日外客数(2003年〜2026年) (visitor arrivals by nationality/month, 2003–2026) | 20260916_1615-5.xlsx ← target |
| 国籍/月別 訪日外客数(2003年〜2026年) (visitor arrivals by nationality/month, 2003–2026) | 20260916_1615-4.pdf |
| 国籍/目的別 訪日外客数(2004年〜2025年) (visitor arrivals by nationality/purpose, 2004–2025) | 20260819_1615-6.pdf |
| ビジット・ジャパン事業開始以降の訪日客数の推移 (visitor arrivals since the start of the Visit Japan campaign) | 20260819_1615-7.pdf |
| 年別 訪日外客数、出国日本人数の推移 (visitor arrivals and Japanese departures by year) | 20260819_1615-8.pdf |
「国籍/月別 訪日外客数」 appears twice, as xlsx and pdf, under the same label, so I picked the Excel version by its extension.
This is a spot where the display name is the same but the content differs — easy for a person to get wrong too. The AI states explicitly on what grounds it made its choice.
The output file was checked in the same way as for the consumption survey.
The magic bytes
504b0304and the Content-Typespreadsheetml.sheetconfirmed it as a genuine xlsx, so no format conversion was needed
504b0304 is the ZIP signature; an .xlsx file is in substance a ZIP file. The AI checked both the signature and the Content-Type.
Contents: 24 sheets (one per year:
2026,2025, …2003), each structured as "market (total / Asia total / Korea / China / Taiwan…) × monthly figures + growth rates"
The 2026 sheet is partial-year data, from January to the latest published month
If you total by year, 2026 alone gives a figure that cannot be compared with the other years. The AI picked this up from the notes in the file and reported it. For an analysis that compares years, decide first how to treat this row.
- Finally, the result for the Ministry of Justice's cruise passenger data. Because 31 monthly files are collected, the key point is whether any are missing.
Screenshot shown in the original Japanese.
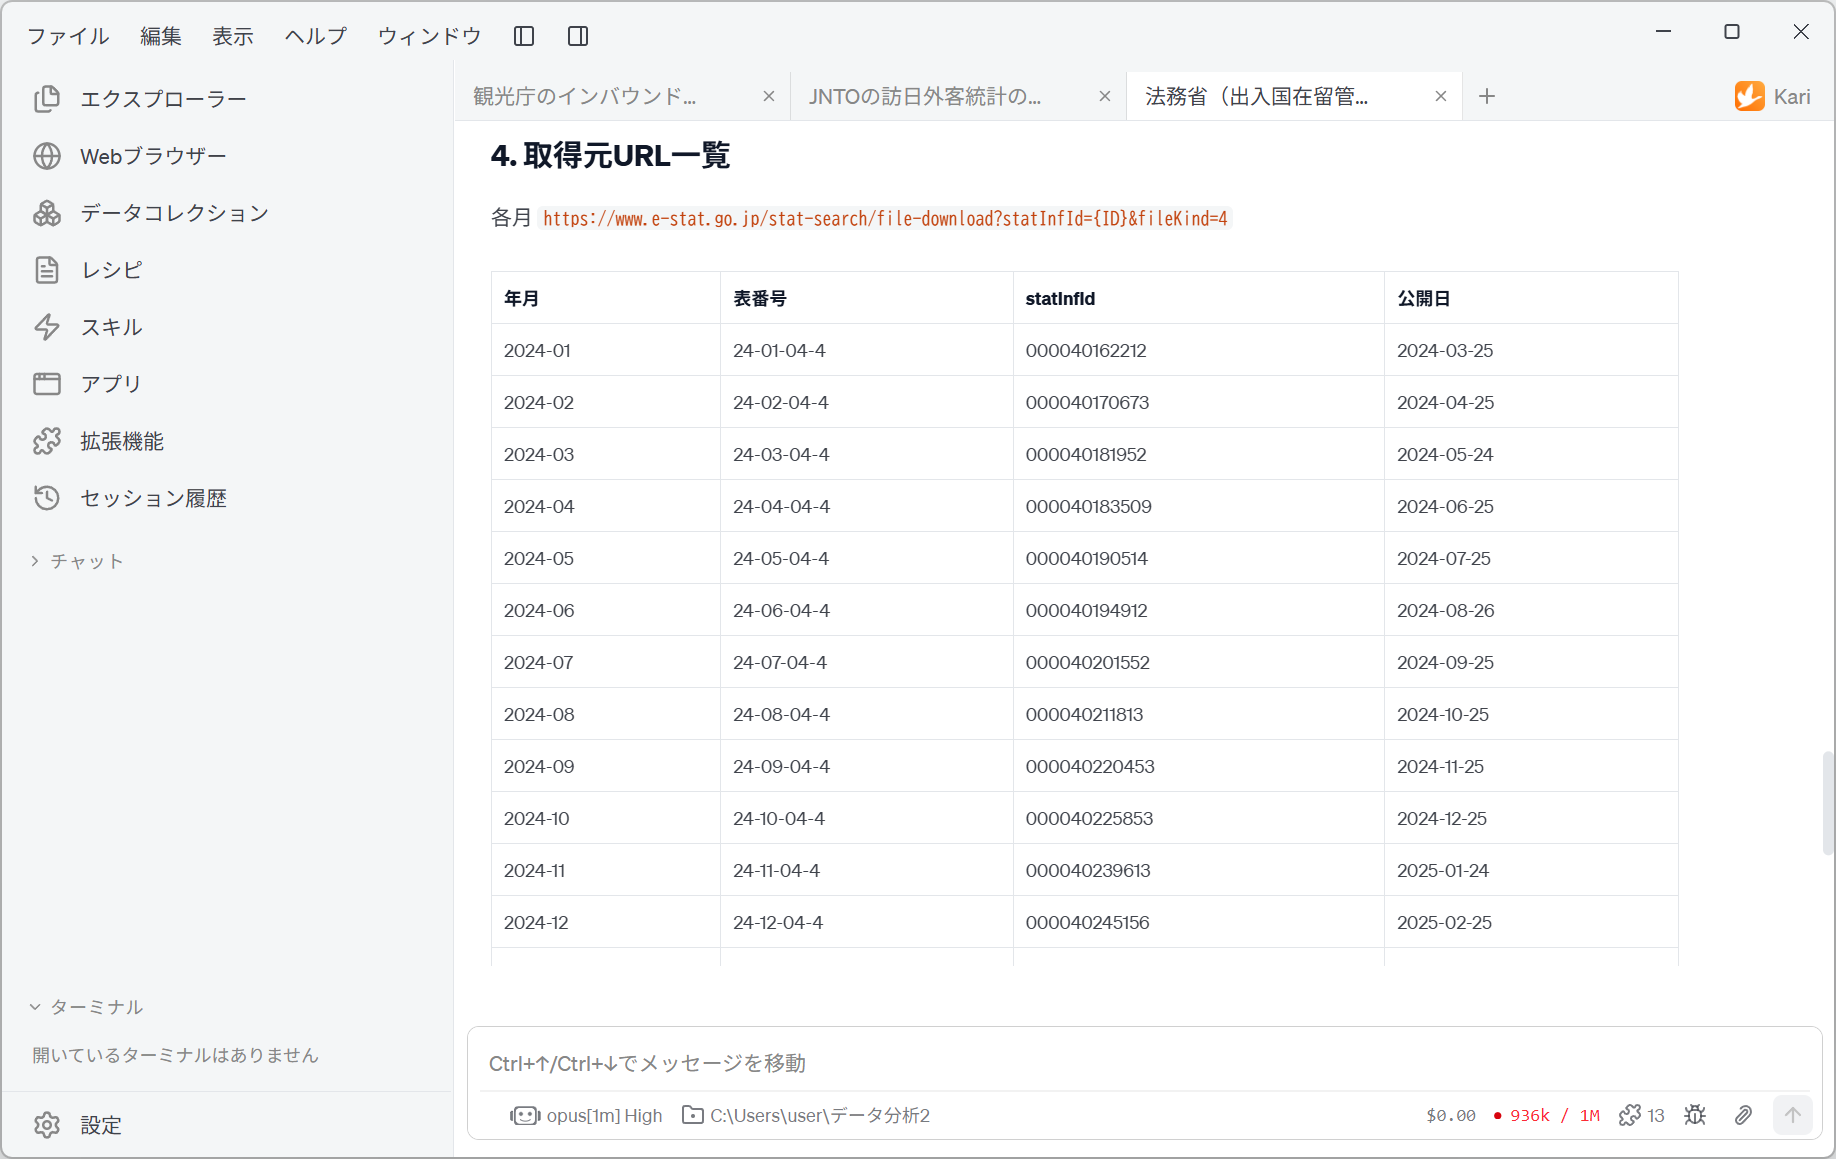
Because instruction 3 asked the AI to "report, as a list, any missing months, the source URLs, and how the formats were handled", which month was taken from where is recorded one by one. The screen shows the list of source URLs, with columns 年月/表番号/statInfId/公開日 (year and month / table number / statInfId / release date).
Each month:
https://www.e-stat.go.jp/stat-search/file-download?statInfId={ID}&fileKind=4
This list lets you confirm that the table numbers run consecutively: 24-01-04-4, 24-02-04-4 and so on. Because e-Stat's search results are not in chronological order, you would not notice a gap without looking here.
The 公開日 (release date) column is useful too. The January 2024 data was released on 2024-03-25: the data is published about two months late. This column explains why the most recent months cannot be retrieved yet.
Check the downloaded Excel files
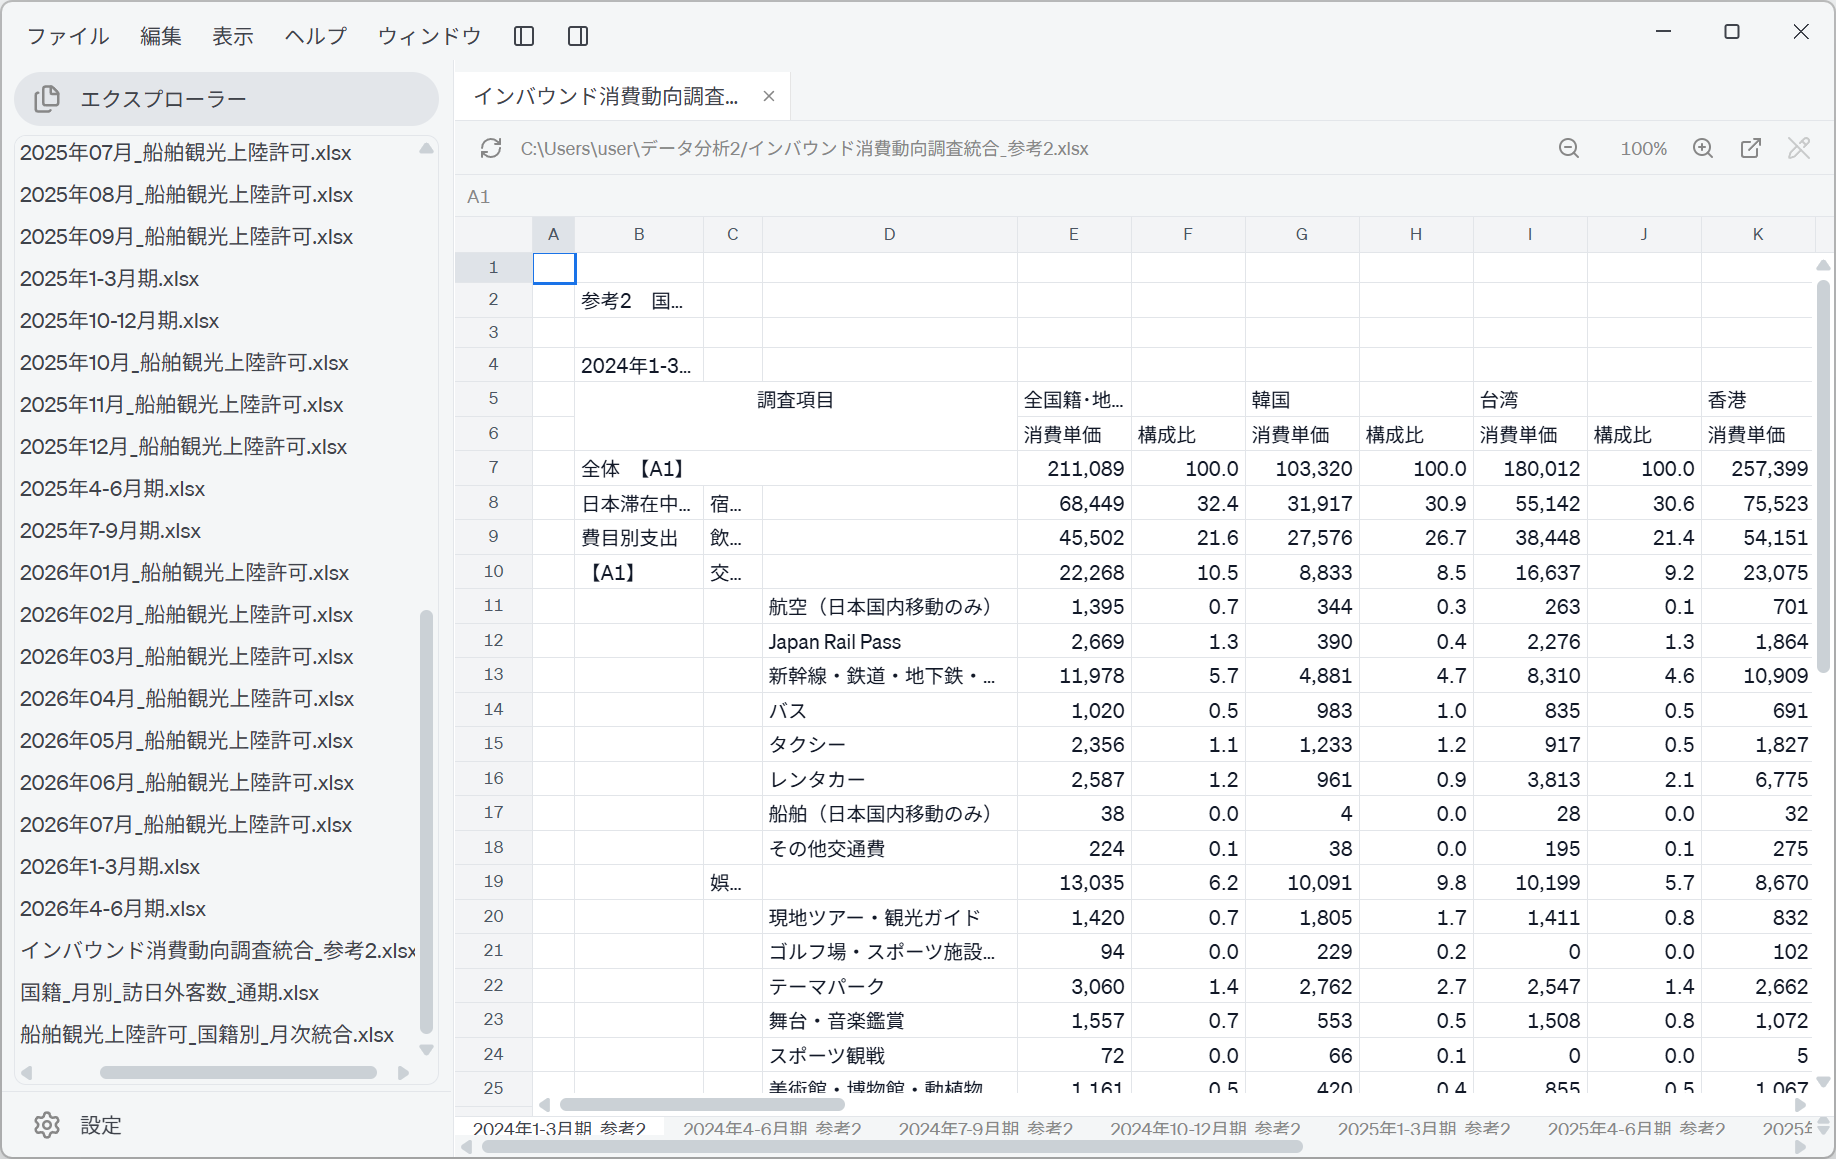
- Check the saved files in Explorer on the left. The 10 quarterly files, the monthly cruise passenger files, the two merged files and the JNTO file are listed.
Screenshot shown in the original Japanese.
When you open the merged file, the sheet tabs at the bottom run in chronological order from 2024年1-3月期_参考2. The sheet naming rule you specified has been applied as given.
The contents of the sheets are not in a form you can use directly for analysis.
- Rows 1 to 4 hold the title and the period label; they are not data
- Row 5 holds the nationalities (
全国籍・地域(all nationalities and regions),韓国(Korea),台湾(Taiwan),香港(Hong Kong)…), and row 6 holds消費単価(spending per person) and構成比(share) — a two-level header - The nationality cells are merged horizontally, with two columns hanging under each
- The rows form three levels: under
全体【A1】(overall) in row 7 come宿泊費(accommodation),飲食費(food and drink),交通費(transport),娯楽等サービス費(entertainment and other services),買物代(shopping) andその他(other), and under those hang sub-items such as航空(日本国内移動のみ)(air, domestic travel within Japan only) andJapan Rail Pass
The 構成比 columns give each expense item's share of 全体. The 全体 row is 100.0.
On the next page, tables with multi-level headers like this are put through AI Analysis on a Data Collection and converted into tables usable for analysis.
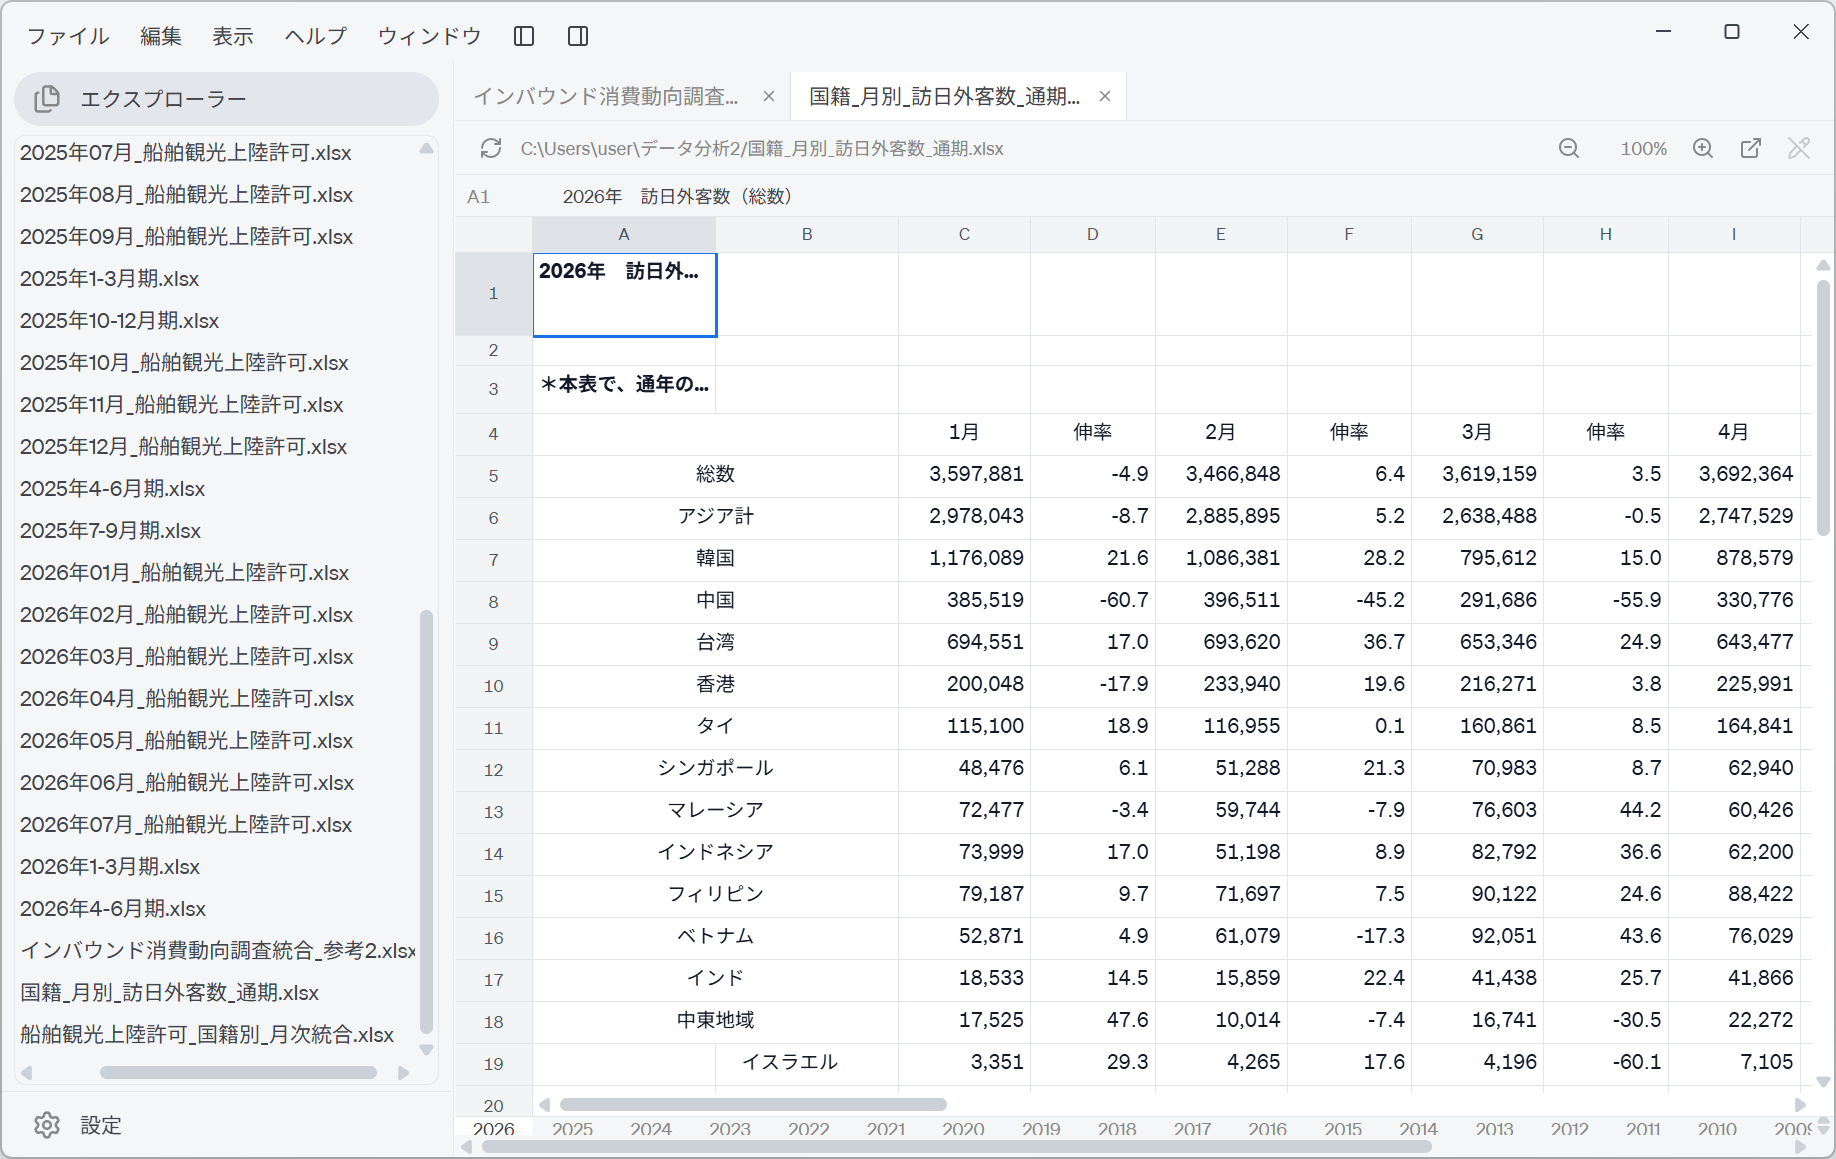
- Check the JNTO file as well.
Screenshot shown in the original Japanese.
The sheet tabs run by year from 2026 to 2003. Each sheet has 「2026年 訪日外客数(総数)」 (2026 visitor arrivals, total) in A1, notes in row 3, and in row 4 a header in which months and growth rates alternate: 1月 (January), 伸率 (growth rate), 2月 (February), 伸率 and so on.
The rows are nested too. Under 総数 (total) comes アジア計 (Asia total), under that 韓国 (Korea), 中国 (China), 台湾 (Taiwan)…, and under 中東地域 (Middle East region) hang イスラエル (Israel), トルコ (Türkiye) and GCC6か国 (six GCC countries). Total rows and breakdown rows are mixed in the same column, so aggregating them as they are counts things twice.
- Check the cruise passenger file as well.
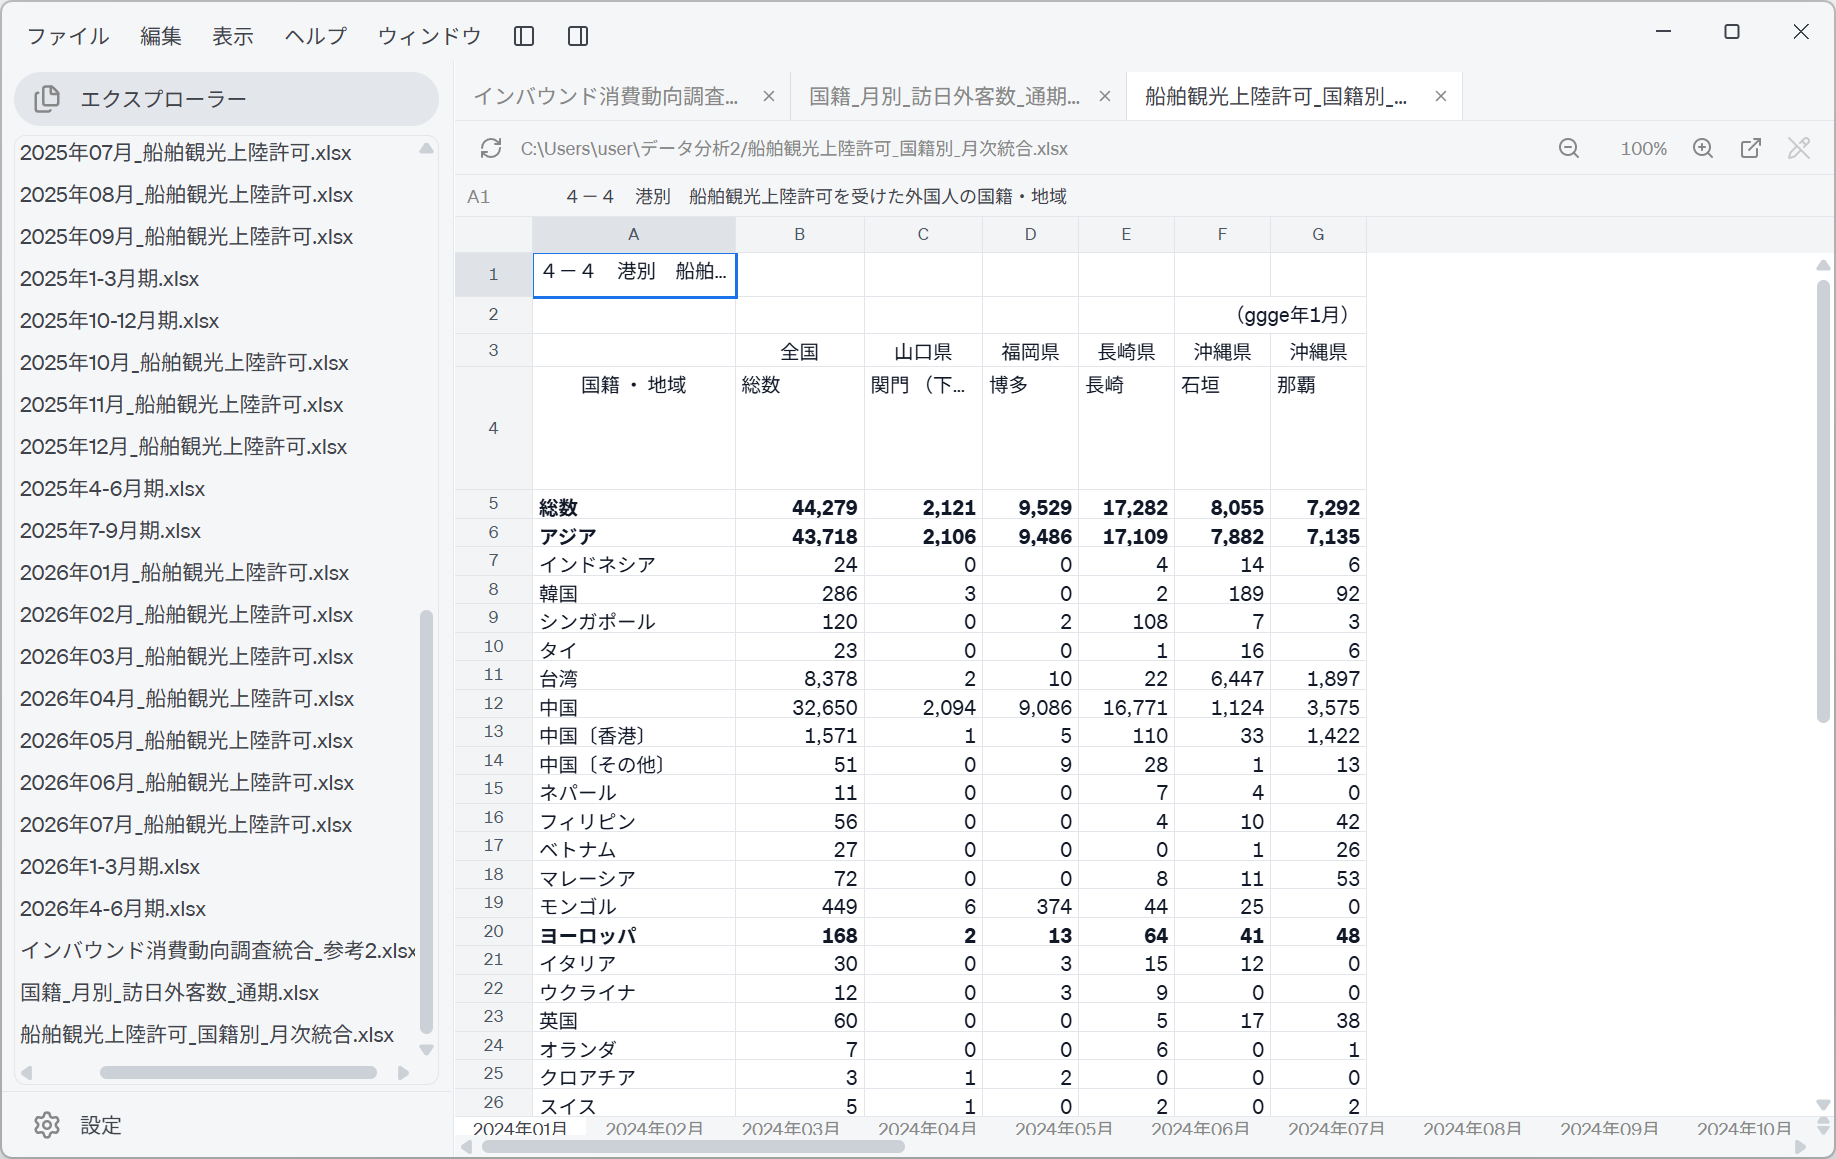
Screenshot shown in the original Japanese.
The sheet tabs run by month from 2024年01月. Each sheet has the title 「4−4 港別 船舶観光上陸許可を受けた外国人の国籍・地域」 (4-4 nationality and region of foreign nationals granted cruise landing permits, by port) in row 1, a two-level header of prefecture names and port names in rows 3 and 4, and from row 5 総数 (total) and アジア (Asia) followed by the individual nationalities and regions.
Column B is "nationwide / total", the nationwide figure used in this use case. Columns C onwards are the breakdown by port, and the ports listed vary from month to month.
The cruise passenger data is divided into categories such as 中国 (China), 中国〔香港〕 (China [Hong Kong]) and 中国〔その他〕 (China [other]), which differ in both labelling and granularity from JNTO's 中国 and 香港. To obtain the number of general visitors by subtraction, the country names have to be mapped to each other.
This matching is covered on the data joining page.
All three files are in a shape that needs reworking before analysis. But there is no need to rework them at this stage.
If you keep them in their original structure, you will not have to retrieve them again later when you want to use a different table (参考1, 表2-1 and so on). Reworking is the job of the next step.
Human-in-the-loop points
Do not leave everything to the AI. Check the following yourself.
-
Decide for yourself which sheet to use
The consumption survey workbook has 37 sheets, with tables of similar names and different contents side by side.表2-1and参考2give spending per person that differs by about 10%. Specify the sheet to use according to what you want to analyze. -
Spot-check the year assignment
Because the link labels do not contain the year, the year was inferred from the page structure. In this example the AI verified it against cell B4 of each sheet, but if you do not ask for that check, a person has to confirm it. Open the files at year boundaries (the January–March and October–December quarters) first. -
Confirm that the files really are Excel
When access is restricted, an HTML error page may be saved under the same file name in place of the Excel file. Either ask for a magic-byte check as in this example, or actually open a few of the files after saving. -
Check the monthly data for gaps
The cruise passenger data comes as a separate file for each month, and e-Stat's search results are not in chronological order. Even with one month missing, the total looks plausible at first glance. Always read the list of months retrieved. -
Design on the assumption that the column layout differs by period
2024 and 2025 have 48 columns (21 categories); 2026 has 54 columns (24 categories). If you process by column position, the data quietly shifts from some period onwards. Include the policy of matching by header name in the instructions for the next step. -
Be aware that preliminary and final figures are mixed
Cell B4 of each sheet carries a label showing the publication stage, such as【確報】(final figures) or【2次速報】(second preliminary figures). Preliminary figures are revised later. In an analysis that includes the most recent periods, record the retrieval date. -
Distinguish total rows from breakdown rows
In both the JNTO and the Ministry of Justice tables, aggregate rows such as総数andアジア計sit in the same column as the individual countries and regions. Adding them up as they are counts the same people twice. The same care is needed as with the "regional hierarchy" in the population data in the Tokyo real estate use case. -
Do not mix partial-year data into year-on-year comparisons
JNTO's 2026 sheet runs only to part of the way through the year. When comparing annual totals, either exclude it or align the number of months. -
Respect the terms of use of the source sites
For secondary use of the retrieved data, follow the conditions set by each body. JNTO requires the source to be stated.
The way the page structure is read and the way file formats are checked vary with the LLM used. Have the AI report on what grounds it chose each file, and check that the explanation is sound.
References
The steps on this page use the following public data for illustration. Screenshots are reproduced as quotations with the source stated. The lists the AI output and the merged files were generated by GotoAI as an example of Kari's operation; they were not created or published by the Japan Tourism Agency, the Japan National Tourism Organization or the Ministry of Justice.
Consumption data
- Material: Consumption Trend Survey for Foreigners Visiting Japan (「インバウンド消費動向調査」; formerly 「訪日外国人消費動向調査」), 「参考2 国籍・地域別 費目別1人1回当たり旅行消費単価(パッケージツアー参加費内訳含む)」 (Reference 2: travel spending per person per trip by nationality/region and expense item, including the breakdown of package tour fees)
- Provider: Japan Tourism Agency (Ministry of Land, Infrastructure, Transport and Tourism)
- URL: https://www.mlit.go.jp/kankocho/tokei_hakusyo/gaikokujinshohidoko.html
- Accessed: October 15, 2026
- Terms of use: In accordance with that website's terms of use. Source: Ministry of Land, Infrastructure, Transport and Tourism website (URL above).
Visitor arrival data
- Material: JNTO's statistics on visitor arrivals (「訪日外客統計」), 「国籍/月別 訪日外客数」 (visitor arrivals by nationality/month; time-series tables)
- Provider: Japan National Tourism Organization (JNTO)
- URL: https://www.jnto.go.jp/statistics/data/visitors-statistics/
- Accessed: October 15, 2026
- Terms of use: Used with the source stated as "Japan National Tourism Organization (JNTO)", as that organization requires.
Cruise passenger data
- Material: Immigration control statistics (「出入国管理統計」), 「港別 船舶観光上陸許可を受けた外国人の国籍・地域」 (nationality and region of foreign nationals granted cruise landing permits, by port; monthly tables)
- Provider: Ministry of Justice (Immigration Services Agency of Japan) / Portal Site of Official Statistics of Japan (e-Stat)
- URL: https://www.e-stat.go.jp/stat-search/files?toukei=00250011
- Accessed: October 16, 2026
- Terms of use: In accordance with that site's terms of use. Source: Ministry of Justice, 「出入国管理統計」 (Immigration control statistics).
- The external information quoted on this site is provided to illustrate examples of using Kari. This site does not guarantee the accuracy or currency of that information. Quoted sources may be changed or removed without notice.
- The AI output shown on this site was actually obtained in the stated verification environment. However, this site does not guarantee the accuracy or usefulness of that output. AI output varies with the LLM used, its settings, and from one run to the next.
- This use case is an illustration of how Kari works, and the figures it produces may differ from those published by the Japan Tourism Agency.
- The data retrieved on this page includes preliminary figures. Preliminary figures are revised in later publications, so treat the analysis results as valid as of the time of retrieval.
- JNTO's 2026 data is partial-year data covering only part of the year. It cannot be used as it is for year-on-year comparisons.
- Screenshots were taken with the version of Kari current at the time of writing. The display may differ in your version.
- Carry out automated downloads from websites in accordance with the target site's terms of use and
robots.txt. Use of the retrieved data is likewise at your own judgement and responsibility. - The bodies and organizations quoted have no affiliation with, and do not endorse, this site or Kari.