Have Kari's AI agent automate visualizing visitor-number trends by nationality and region, and drawing out insights
Copyright © 2026GotoAI Inc.Based on the goose project
The steps on this page were verified in the following environment.
- Kari: version 0.7.3, Windows
- AI provider: Anthropic Claude subscription
- Model: Claude Opus 5.5 High
About this page
On the previous page, the fact table that underpins the analysis was completed. From here we move on to the data analysis proper.
The first thing to look at is visitor numbers. This analysis establishes who is coming, and how many.
The work on this page consists of two tasks.
| Content | |
|---|---|
| Visualization | Put 31 months of trends into a single Chart, stacked by nationality and region |
| Drawing out insights | Have the AI itself read the data behind that Chart and put the trends and insights into words |
The second task is the point of this page. A chart shows "what happened", but drawing out insights — "what it means" — is the real output of an analysis. Both creating the Chart and drawing out the insights can be left to the AI.
On the previous page, we noted that care is needed because the quarterly spending per person was copied to each month.
However, the three headcount columns (訪日外客数 (visitor arrivals), クルーズ客数 (cruise passengers) and 一般客数 (general visitors)) are all monthly data. They have not been duplicated. The monthly trend in headcounts can therefore be analyzed correctly. Note that even within the same fact table, the usable granularity differs from column to column.
What to count as "visitor numbers"
The fact table has three headcount columns. On this page, the main subject is the number of general visitors (visitor arrivals minus cruise passengers).
There are two reasons.
- It lets us talk on the same base as total spending on the next page. Total spending is estimated as "travel spending per person × number of general visitors". If only the visitor-number page talked in terms of visitor arrivals, the figures on the two pages would not fit together
- Cruise passengers behave differently from visitors arriving by air or land. If you add someone who calls at a port by ship and stays a few hours to someone who books accommodation and stays, counting each as one person, the picture of the market is distorted
From here on, everything this page calls "visitor numbers" is the number of general visitors.
Instruct the AI
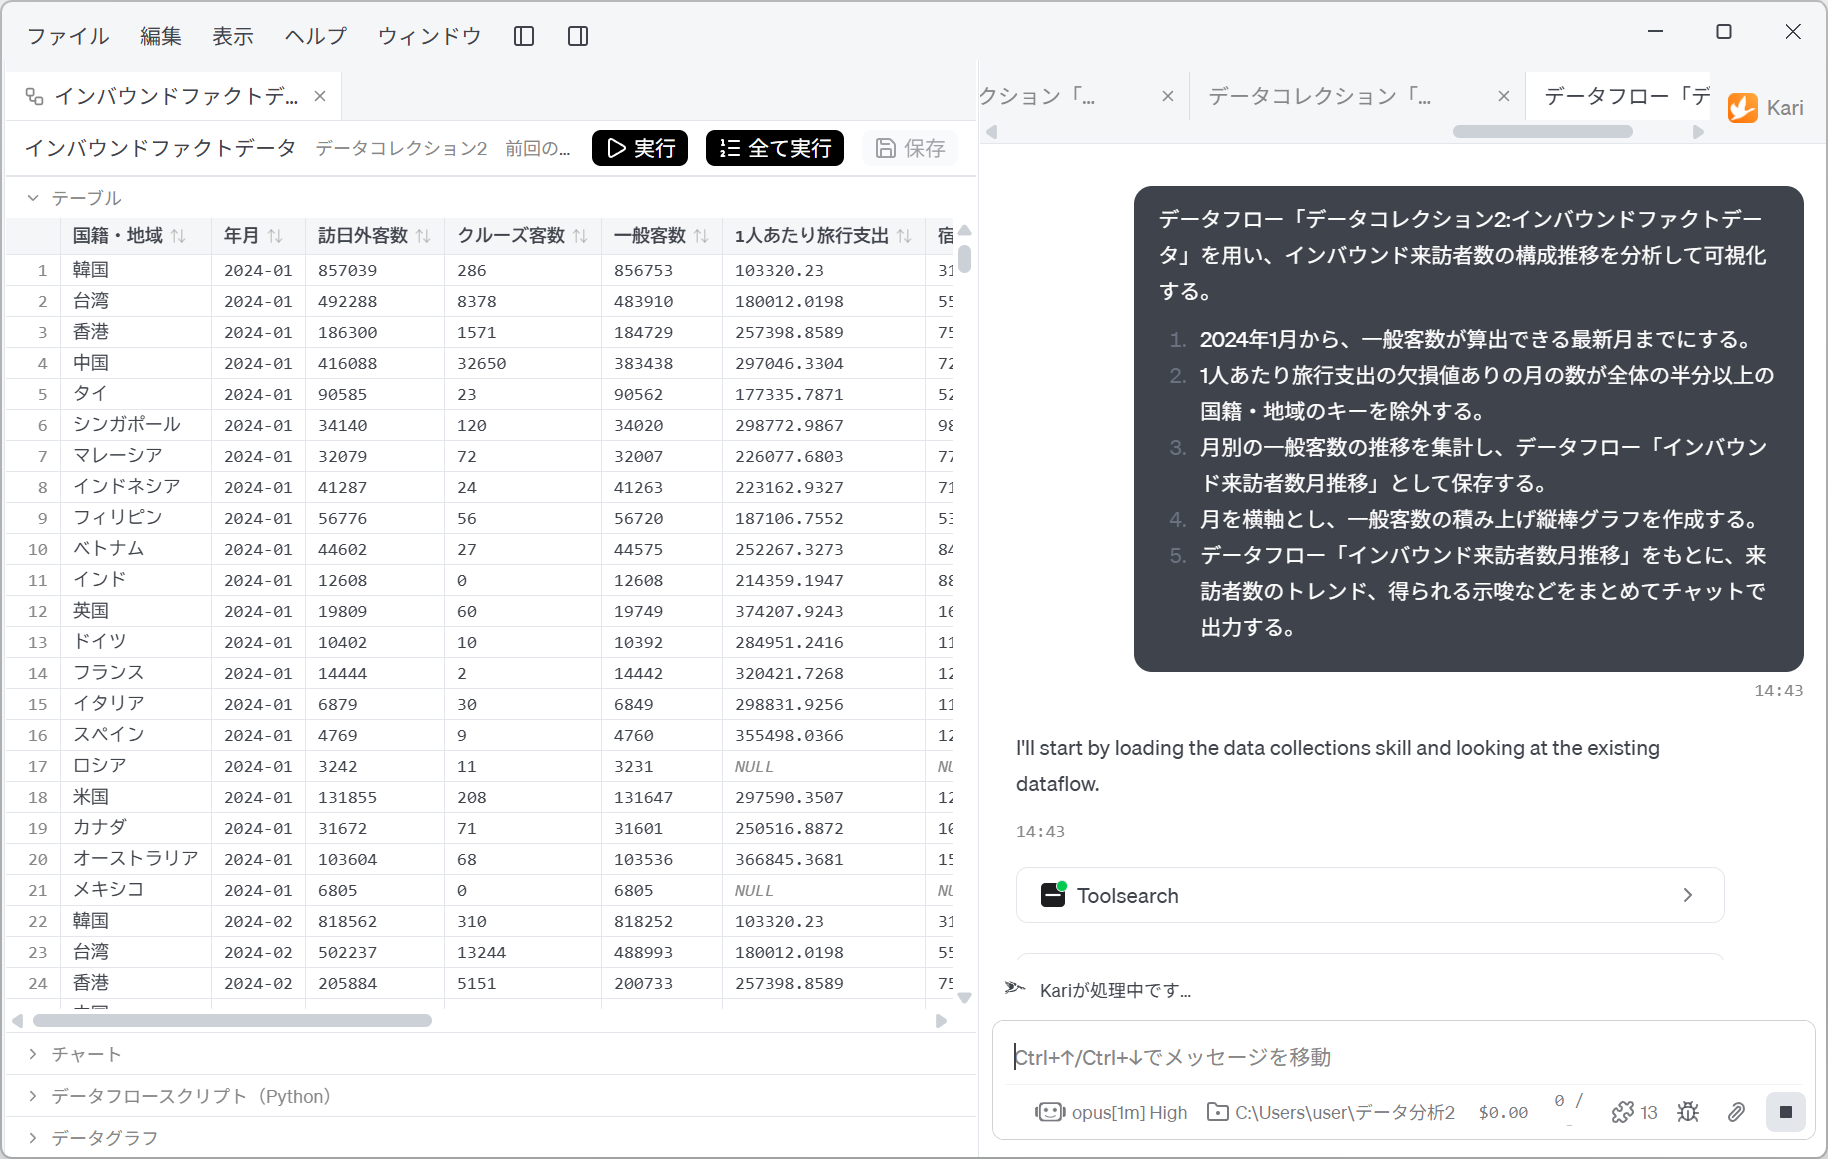
- Instruct the AI on everything together: the period, the exclusion conditions, the aggregation, the Chart and drawing out insights. The prompt below is an English rendering of the Japanese prompt shown in the screenshot; Dataflow names are quoted as they appear in Kari.
Using the Dataflow 「データコレクション2:インバウンドファクトデータ」, analyze and visualize the trend in the composition of inbound visitor numbers.

1. Cover the period from January 2024 to the latest month for which the number of general visitors can be calculated.
2. Exclude the nationality/region keys for which the number of months with missing values in travel spending per person is half or more of the total.
3. Aggregate the monthly trend in the number of general visitors, and save it as the Dataflow 「インバウンド来訪者数月推移」.
4. Create a stacked column chart of the number of general visitors, with month on the horizontal axis.
5. Based on the Dataflow 「インバウンド来訪者数月推移」, summarize the trends in visitor numbers, the insights they give, and so on, and output them in the chat.
Screenshot shown in the original Japanese.
The way this prompt is put together has the following points.
| Block of the prompt | Aim |
|---|---|
| 1. Specifying the period | The end is specified by a condition: "to the latest month for which the number of general visitors can be calculated". The fact table runs to August 2026, but cruise passenger numbers only go up to July. If you write just "the latest month", August, from which cruise passengers have not been subtracted, gets mixed in. |
| 2. Exclusion for missing values | Keys with many missing values are dropped mechanically. A nationality or region missing travel spending per person in half or more of the 31 months cannot be used in the spending analysis that follows. The decision is to align the keys up front. |
| 3. Saving the aggregate to a Dataflow | Rather than just drawing a Chart, the AI is made to keep the aggregated result. In step 5 the AI reads it back. |
| 4. Specifying the shape of the Chart | "Month on the horizontal axis, stacked columns". This is the shape for looking at changes in composition. |
| 5. Outputting trends and insights | This is the main purpose of this page. The AI is made to read the Dataflow it created and put it into words. |
Note that the AI is made to save a Dataflow in step 3 and then read it in step 5. Rather than giving its impressions from the image of the Chart alone, the prompt is structured so that the AI re-reads the numbers themselves. This lets it handle "figures that are not drawn on the chart", such as cumulative totals and shares.
The three data sets in the fact table end at different months.
| Column | Last month |
|---|---|
| 訪日外客数 (visitor arrivals) | August 2026 |
| クルーズ客数 (cruise passengers) | July 2026 |
| 1人あたり旅行支出 (travel spending per person) | April–June 2026 quarter |
If you set the period "up to August 2026", August alone contributes a number of general visitors from which cruise passengers have not been subtracted (that is, the visitor arrivals figure itself). These are the cells the AI set to Null on the previous page. If they are aggregated as Null, the monthly total is incomplete; if they are treated as 0, August alone is overstated.
That is why prompt item 1 is written as a condition: "to the latest month for which the number of general visitors can be calculated".
Check the Chart that was created
Screenshot shown in the original Japanese.
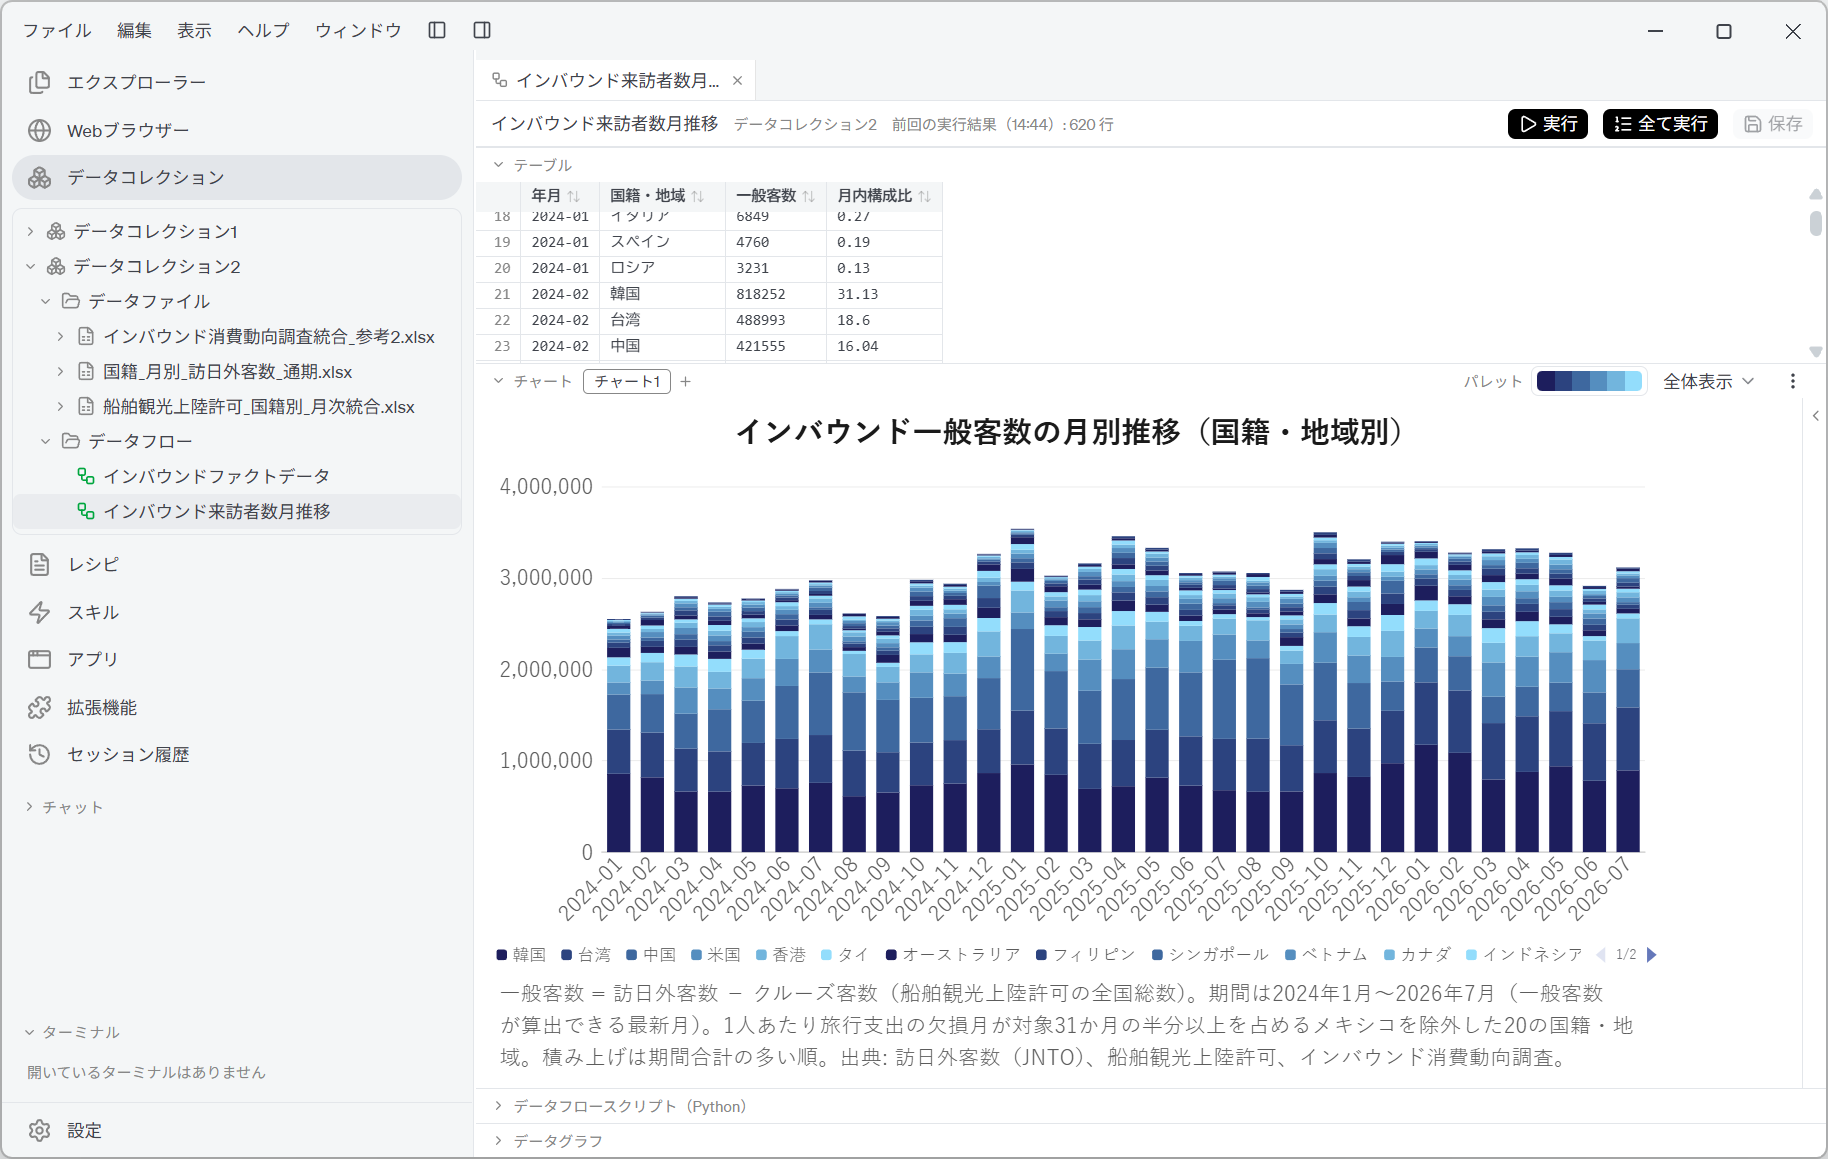
The Dataflow 「インバウンド来訪者数月推移」 (monthly trend in inbound visitor numbers) has 620 rows: 31 months × 20 nationalities and regions, from January 2024 to July 2026.
The columns are 年月 (year and month), 国籍・地域 (nationality/region), 一般客数 (general visitors) and, not in the prompt, 月内構成比 (share within the month). Like 調査期間 (survey period) on the previous page, this is a column the AI added so that the result can be traced later. The percentage of the whole that each block of the stacked chart represents is also kept as a number.
The Chart's note sets out the definition and the reasons for exclusion in one paragraph.
General visitors = visitor arrivals − cruise passengers (national total of cruise landing permits (「船舶観光上陸許可」)). Period: January 2024 – July 2026 (the latest month for which the number of general visitors can be calculated). 20 nationalities and regions, excluding Mexico, whose months with missing travel spending per person make up half or more of the 31 months covered. Stacked in descending order of period total. Sources: visitor arrivals (JNTO), cruise landing permits, Consumption Trend Survey for Foreigners Visiting Japan.
A single Chart tells you three things: what the headcount on the vertical axis counts (general visitors, with cruise passengers subtracted), why it stops at July, and which of the 21 keys was dropped. The conditions written in the prompt become, as they stand, the explanation for the reader.
The fact table on the previous page had 21 nationalities and regions. Prompt item 2 excluded one, Mexico, leaving 20. Because how many were dropped, and why, is stated explicitly, you can account for the difference in row counts.
Because the stacking order is "descending order of period total", the main markets are stacked from the bottom up. The legend begins with South Korea (韓国), Taiwan (台湾), China (中国), the United States (米国) and Hong Kong (香港).
Mexico is a country added to the consumption survey's categories from 2026. For the 24 months from January 2024 to December 2025, there is no travel spending per person. With 25 of the 31 months missing, it meets the condition in prompt item 2 (half or more).
Russia, by contrast, is missing only the three months of the January–March 2024 quarter. That is nowhere near half, so it stays. Even among "countries with missing values", the treatment differs with the amount missing.
Headcount data exists for Mexico for every month. For an analysis that looks only at visitor numbers, not excluding it would also be a valid choice. Here it is dropped to keep the scope the same as the spending analysis on the next page.
Read the AI's analysis and insights
Screenshot shown in the original Japanese.
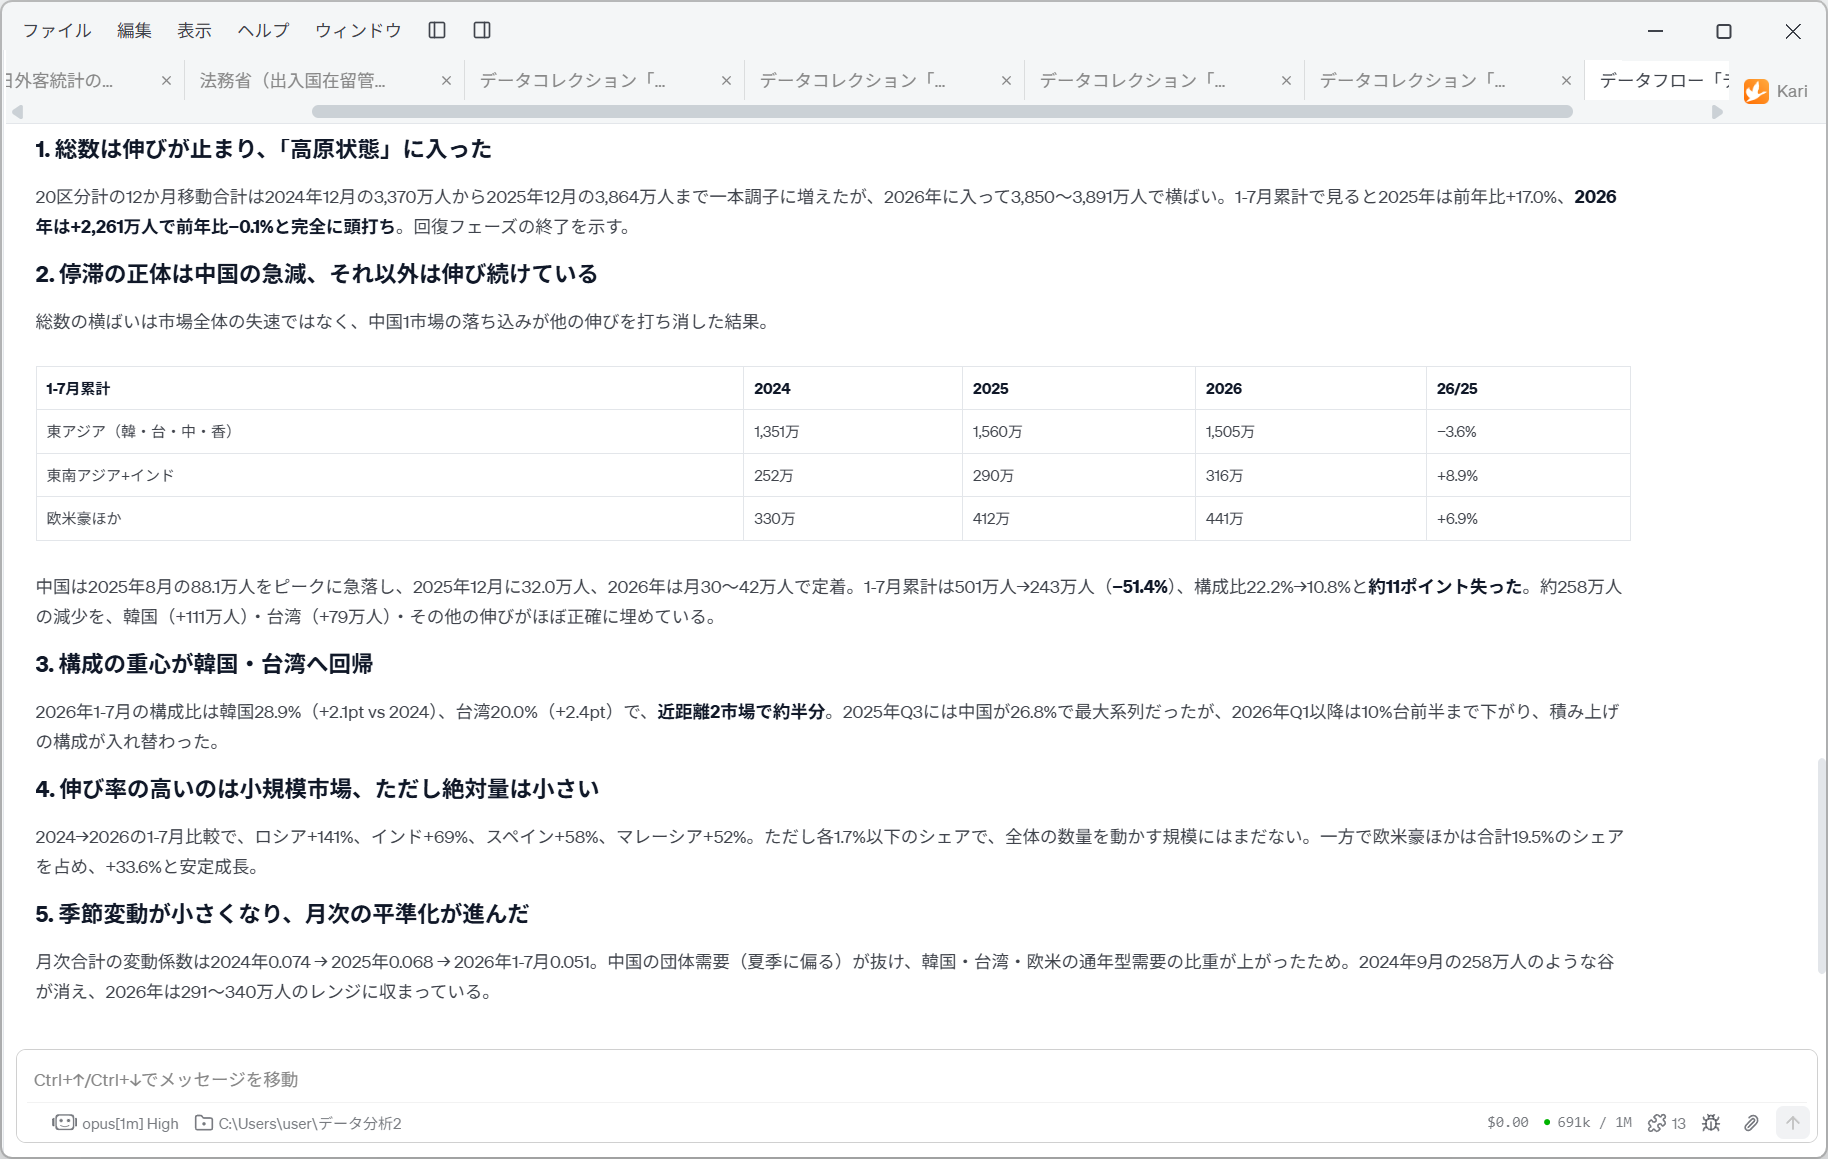
The AI's answer consists of five observations.
1. Total growth has stopped and entered a "plateau"
The 12-month moving total for the 20 categories rose steadily from 33.70 million in December 2024 to 38.64 million in December 2025, but since the start of 2026 it has been flat at 38.50–38.91 million. On a January–July cumulative basis, 2025 was +17.0% year on year, while 2026, at 22.61 million, is −0.1% year on year — growth has stalled completely. This marks the end of the recovery phase.
Note that two views are used together. The 12-month moving total removes seasonality to show the level; the January–July cumulative total puts the years on the same number of months. The first identifies "when the increase stopped"; the second confirms that "the year-on-year change is almost zero".
Because 2026 only runs to July, comparing full-year totals would leave 2026 five months short. Aligning all three years on January–July is essential.
2. The stagnation is really China's sharp fall; everything else keeps growing
This is the most valuable analysis on this page.
The flat total is not a slowdown of the market as a whole; it is the result of a fall in one market, China, cancelling out growth elsewhere.
January–July cumulative 2024 2025 2026 26/25 East Asia (South Korea, Taiwan, China, Hong Kong) 13.51 million 15.60 million 15.05 million −3.6% Southeast Asia + India 2.52 million 2.90 million 3.16 million +8.9% Europe, North America, Australia and others 3.30 million 4.12 million 4.41 million +6.9% China peaked at 881,000 in August 2025, then fell sharply to 320,000 in December 2025, and in 2026 has settled at 300,000–420,000 a month. The January–July cumulative total went from 5.01 million to 2.43 million (−51.4%), and its share from 22.2% to 10.8% — a loss of about 11 points. The decrease of about 2.58 million has been almost exactly filled by growth in South Korea (+1.11 million), Taiwan (+790,000) and others.
Looking only at the headline figure of −0.1% for the whole, you would read it as "inbound has peaked". But split into three blocks, everything outside East Asia keeps growing, and the flat total is the result of the others filling the −2.58 million in the single market of China. This is a typical case of a total hiding its breakdown.
Without being told to, the AI created the regional blocks itself. Listing the 20 keys individually would only show that "they are all moving". Grouping them into three brought out the picture that only one block is shrinking.
3. The centre of gravity of the mix returns to South Korea and Taiwan
In January–July 2026, South Korea's share is 28.9% (+2.1pt vs 2024) and Taiwan's 20.0% (+2.4pt): the two nearby markets make up about half. In Q3 2025 China was the largest series at 26.8%, but from Q1 2026 onwards it fell to the low teens, and the composition of the stack has been reshuffled.
The fact that "a year earlier China was the largest" is added. What it means that the order of colours in the Chart has changed is backed up with numbers.
That the two nearby markets make up about half also means that the degree of concentration has not changed from the days of dependence on China.
4. The highest growth rates are in small markets, but the absolute volumes are small
Comparing January–July 2024 with 2026: Russia +141%, India +69%, Spain +58%, Malaysia +52%. However, each has a share of 1.7% or less, not yet large enough to move the overall volume. Meanwhile, Europe, North America, Australia and others together hold a 19.5% share and show steady growth of +33.6%.
The story that "growth markets fill the gap" is checked against scale and rejected. A high growth rate and a contribution in volume are two different things.
On top of that, the view that taken together they come to 19.5% is also presented. Small individually, they are a block of a size that cannot be ignored. This is where the same data is cut two ways and both conclusions are drawn.
5. Seasonal variation has narrowed, and the months are levelling out
The coefficient of variation of the monthly totals went from 0.074 in 2024 to 0.068 in 2025 and 0.051 in January–July 2026. This is because Chinese group demand (concentrated in summer) has dropped out, and the weight of year-round demand from South Korea, Taiwan, Europe and North America has risen. Troughs like the 2.58 million in September 2024 have disappeared, and 2026 stays within a range of 2.91–3.40 million.
That the bars in the Chart are becoming more even in height is turned into a single number, the coefficient of variation. The important point is that, rather than saying by eye that "it has been flat recently", it is shown by calculation.
It also connects the levelling to its cause. Observation 2 said that "China has fallen", and here it links that to "Chinese demand was concentrated in summer", so that one change explains two phenomena.
Smaller variation makes capacity easier to plan. On the other hand, it can also be read as the peak-season high having become lower.
The AI makes no value judgement here. It states only the fact that "levelling has progressed" and leaves it to the reader whether that is desirable. Even when you ask for insights, it does not say what the data cannot support — check where that line is drawn.
Human-in-the-loop points
Do not leave everything to the AI. Check the following yourself.
-
State clearly what headcount "visitor numbers" counts
The figures on this page are all general visitors (visitor arrivals minus cruise passengers). They do not match the published visitor arrivals. When you quote the figures, always give the definition with them. That is why the Chart's note begins with the definition. -
Shares are ratios "within the 20 keys"
Mexico has been excluded, and the total rows (総数 (total), アジア計 (Asia total) and so on) were already dropped at the fact-table stage. "South Korea 28.9%" is therefore not a share of all visitor arrivals. It is a share of the total for the 20 nationalities and regions. When quoting figures externally, state this denominator. -
Check that comparisons are made over aligned periods
2026 only runs to July. In this example the AI aligned all three years on January–July cumulative totals, but always check that this has been done. Comparing full-year totals gives 2026 a figure five months short. -
Check which keys were excluded, and why
Mexico was dropped because "travel spending per person is missing in half or more of the 31 months". Note that it was excluded because of the spending data, even though visitor-number data exists for it. -
Inspect the block boundaries the AI created
The three categories in observation 2 — "East Asia / Southeast Asia + India / Europe, North America, Australia and others" — were not in the prompt; the AI decided them. Drawing the boundaries differently changes how the conclusions look. Check which key went into which block. -
Corroborate the cause of "China's sharp fall" outside the data
The AI shows the sharp fall from August 2025 to December 2025 in numbers, but the reason for it is not in the data. Corroborate factors such as policy, flight operations and exchange rates in news reports and published material before using them in a conclusion. -
Do not confuse growth rates with scale
"Russia +141%" and "China −51.4%" look comparable as rates. In actual numbers, though, they differ by orders of magnitude. A market with a high growth rate is not necessarily a substitute in volume. Observation 4 performs this check. -
Take seasonality into account when judging levels
Single-month increases and decreases include seasonal factors. As observation 5 shows, the size of seasonality itself also changes from year to year. Look at year-on-year changes for the same month, or smooth with moving averages. -
Columns other than headcounts have different constraints
The spending per person in this fact table is a quarterly value copied to each month. Just because the headcount analysis worked, you cannot discuss spending per person at the same granularity.
The perspectives the AI focuses on and the depth of the insights vary greatly with the LLM used. Always check the reported figures against the values in the Dataflow. Cumulative totals, shares and year-on-year comparisons in particular are calculated results that are not drawn on the chart.
References
The data analyzed on this page are the three public data sets retrieved, parsed and joined on the preceding pages. Screenshots are reproduced as quotations with the source stated. The aggregates, interpretations of trends and insights calculated by the AI were generated by GotoAI as an example of Kari's operation; they were not created or published by the Japan Tourism Agency, the Japan National Tourism Organization or the Ministry of Justice.
Consumption trend data
- Material: Consumption Trend Survey for Foreigners Visiting Japan (「インバウンド消費動向調査」, formerly 「訪日外国人消費動向調査」), 「参考2 国籍・地域別 費目別1人1回当たり旅行消費単価(パッケージツアー参加費内訳含む)」 (Reference 2: travel spending per person per trip by nationality/region and expense item, including the breakdown of package tour fees)
- Provider: Japan Tourism Agency (Ministry of Land, Infrastructure, Transport and Tourism)
- URL: https://www.mlit.go.jp/kankocho/tokei_hakusyo/gaikokujinshohidoko.html
- Accessed: October 15, 2026
- Terms of use: In accordance with that website's terms of use. Source: Ministry of Land, Infrastructure, Transport and Tourism website (URL above).
Visitor arrivals data
- Material: JNTO's statistics on visitor arrivals (「訪日外客統計」), 「国籍/月別 訪日外客数」 (visitor arrivals by nationality and month; time-series table)
- Provider: Japan National Tourism Organization (JNTO)
- URL: https://www.jnto.go.jp/statistics/data/visitors-statistics/
- Accessed: October 15, 2026
- Terms of use: In accordance with JNTO's rules, used with "Japan National Tourism Organization (JNTO)" (「日本政府観光局(JNTO)」) stated as the source.
Cruise passenger data
- Material: Immigration control statistics (「出入国管理統計」), 「港別 船舶観光上陸許可を受けた外国人の国籍・地域」 (nationality/region of foreign nationals granted cruise landing permits, by port; monthly table)
- Provider: Ministry of Justice (Immigration Services Agency of Japan) / Portal Site of Official Statistics of Japan (e-Stat)
- URL: https://www.e-stat.go.jp/stat-search/files?toukei=00250011
- Accessed: October 16, 2026
- Terms of use: In accordance with that site's terms of use. Source: Ministry of Justice, 「出入国管理統計」.
- The external information quoted on this site is provided to illustrate examples of using Kari. This site does not guarantee the accuracy or currency of that information. Quoted sources may be changed or removed without notice.
- The AI output shown on this site was actually obtained in the stated verification environment. However, this site does not guarantee the accuracy or usefulness of that output. AI output varies with the LLM used, its settings, and from one run to the next.
- This use case is an illustration of how Kari works, and the figures it produces may differ from those published by the Japan Tourism Agency.
- The "number of general visitors" on this page is an approximation calculated as "visitor arrivals − cruise landing permits", and there is no guarantee that it matches the Japan Tourism Agency's estimate.
- The shares on this page use the total for the 20 nationalities and regions analyzed as the denominator. They are not shares of all visitor arrivals.
- The interpretations of market trends and the insights shown on this page were generated by the AI from this data. This site has not verified their causal relationships or background. If you use them for business decisions, always check them against the primary sources and other sources of information.
- The 2026 data is a partial period, up to July. Comparisons between years require aligning the periods.
- Screenshots were taken with the version of Kari current at the time of writing. The display may differ in your version.
- The organizations and bodies quoted have no affiliation with, and do not endorse, this site or Kari.