Automate the parsing of Excel files with Kari's AI Analysis feature
Copyright © 2026GotoAI Inc.Based on the goose project
The steps on this page were verified in the following environment.
- Kari: version 0.7.3 Windows
- AI provider: Anthropic Claude Subscription
- Model: Claude Opus 5.5 High
About this page
The three Excel files obtained on the previous page are tables made for people to read; they are not yet in a form you can use for analysis straight away.
Excel files give a great deal of freedom in how they are laid out, but that means the data structure can be complex, and the way the data is put together can differ from sheet to sheet. A single sheet can also contain several tables of data.
Kari's AI Analysis is the feature that leaves this judgement to the AI. Based on how each sheet is laid out, it finds where the tables are, decides the range to read, and creates the Tables.
The three files on this page each have a different difficulty.
| File | Sheets | What makes it hard |
|---|---|---|
| インバウンド消費動向調査統合_参考2 (consumption trend survey, combined, Reference 2) | 10 | Multi-row headers, three levels of rows, the number of columns differs by year |
| 国籍_月別_訪日外客数_通期 (visitor arrivals by nationality and month, all years) | 24 | Months and growth rates alternate, four different structures depending on the year |
| 船舶観光上陸許可_国籍別_月次統合 (cruise landing permits by nationality, monthly, combined) | 31 | Two-row header of prefecture and port, the number of columns differs by month |
Automate parsing of raw CSV data used the same AI Analysis, but the prompt that is sent is different.
A CSV is by definition "one table per file", so the prompt centred on converting types. With Excel, it starts by finding where the tables are. You don't know how many sheets a workbook has, or how many tables each sheet holds, until you open it.
Create a new Data Collection
- Hover over Data Collection in the navigation panel on the left and click Add Data Collection.
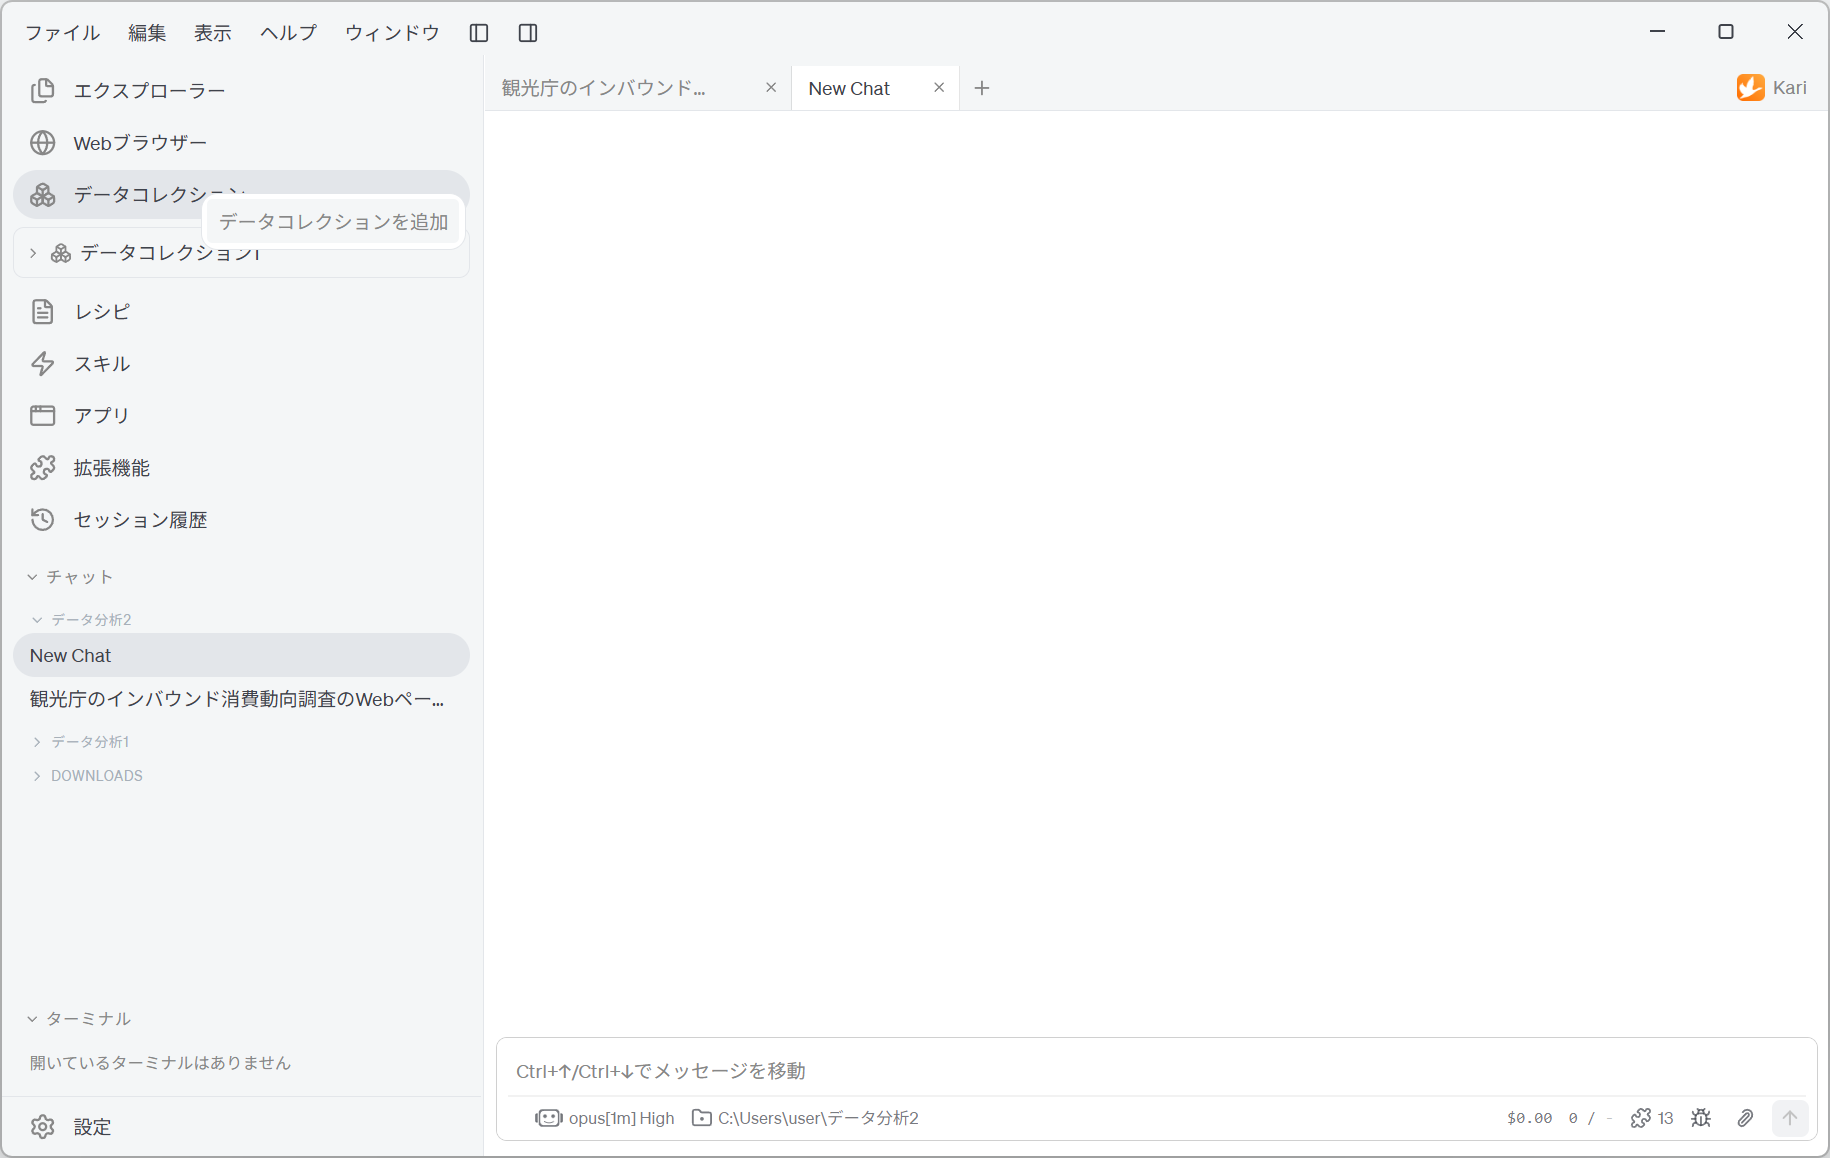
Screenshot shown in the original Japanese.
In this example, we create 「データコレクション2」 (Data Collection 2) and carry out the analysis in it.
Add the Excel files
- Under Data File, choose Add Data File….
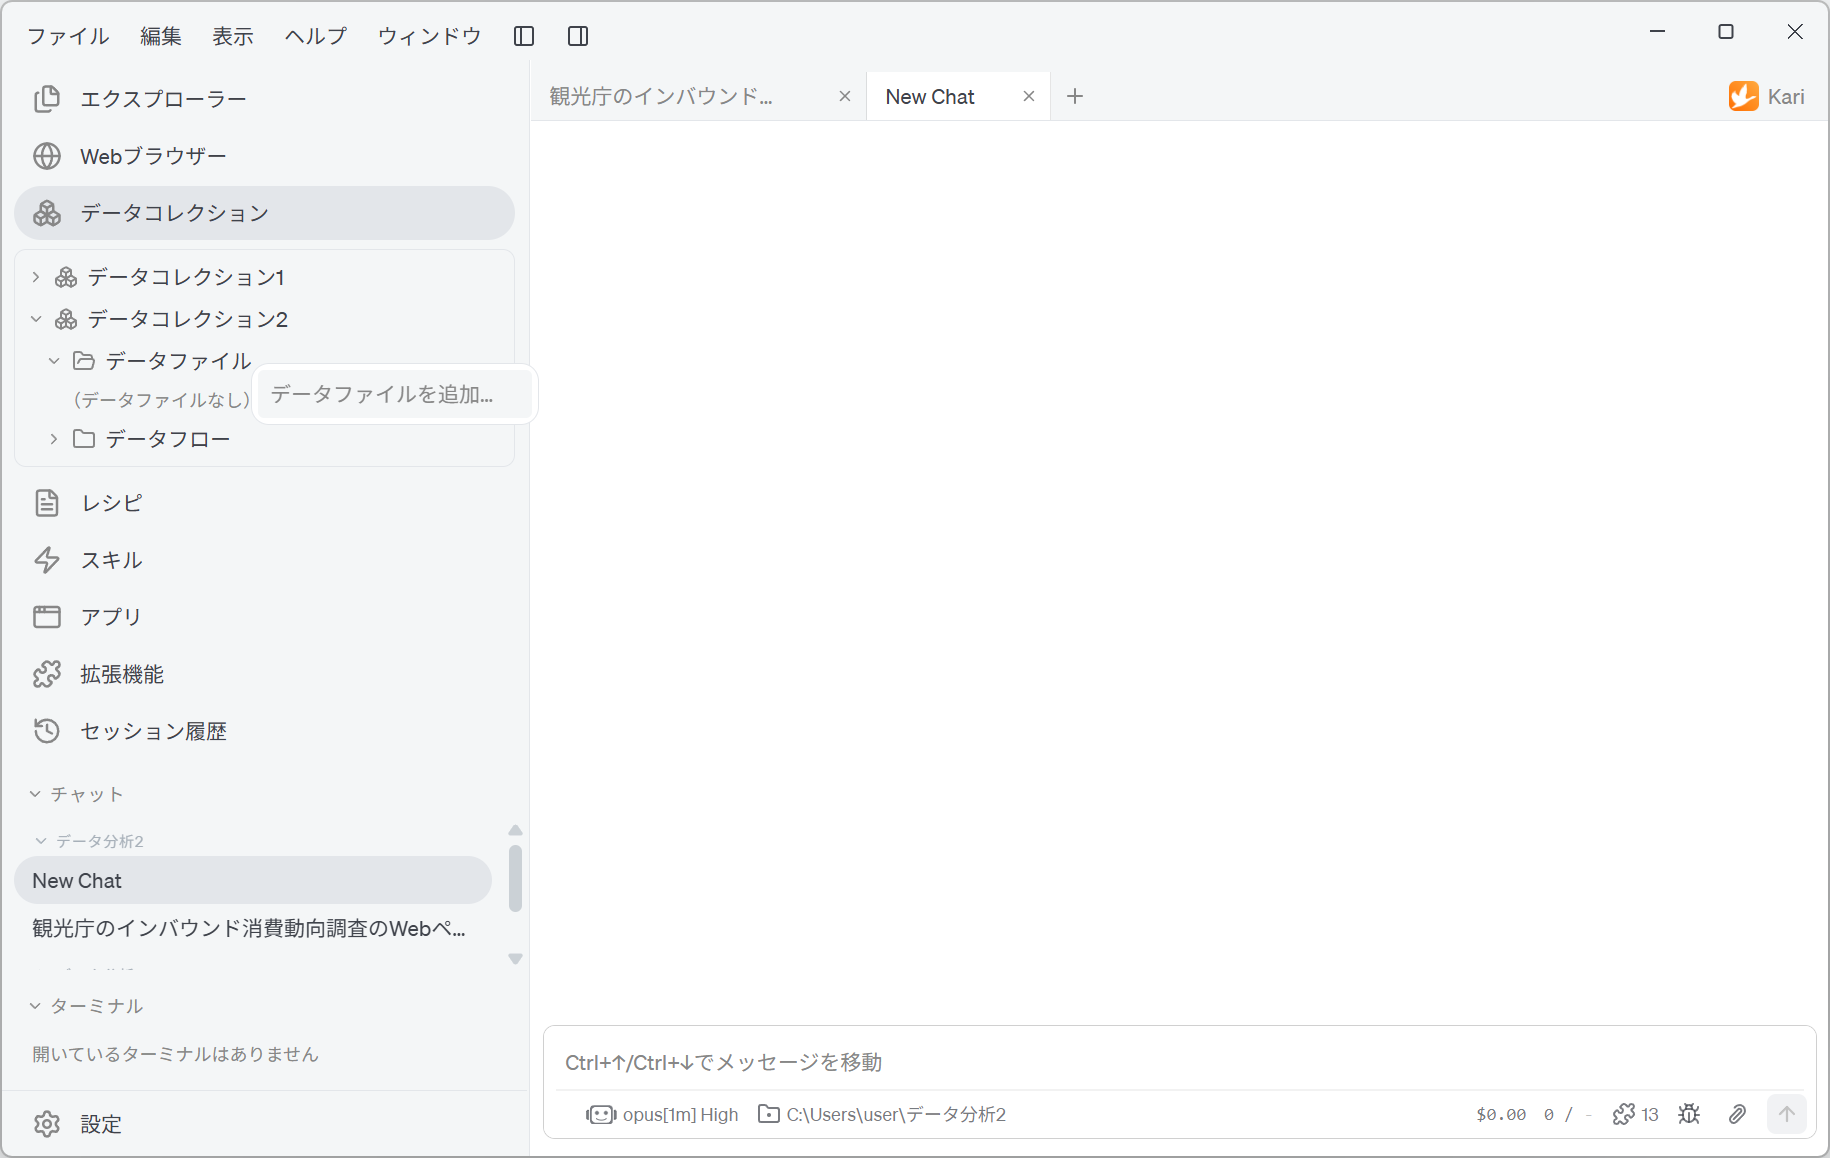
Screenshot shown in the original Japanese.
- In the dialog for choosing the type, choose Add Excel file. The supported formats are
.xlsx.xlsm.xls.
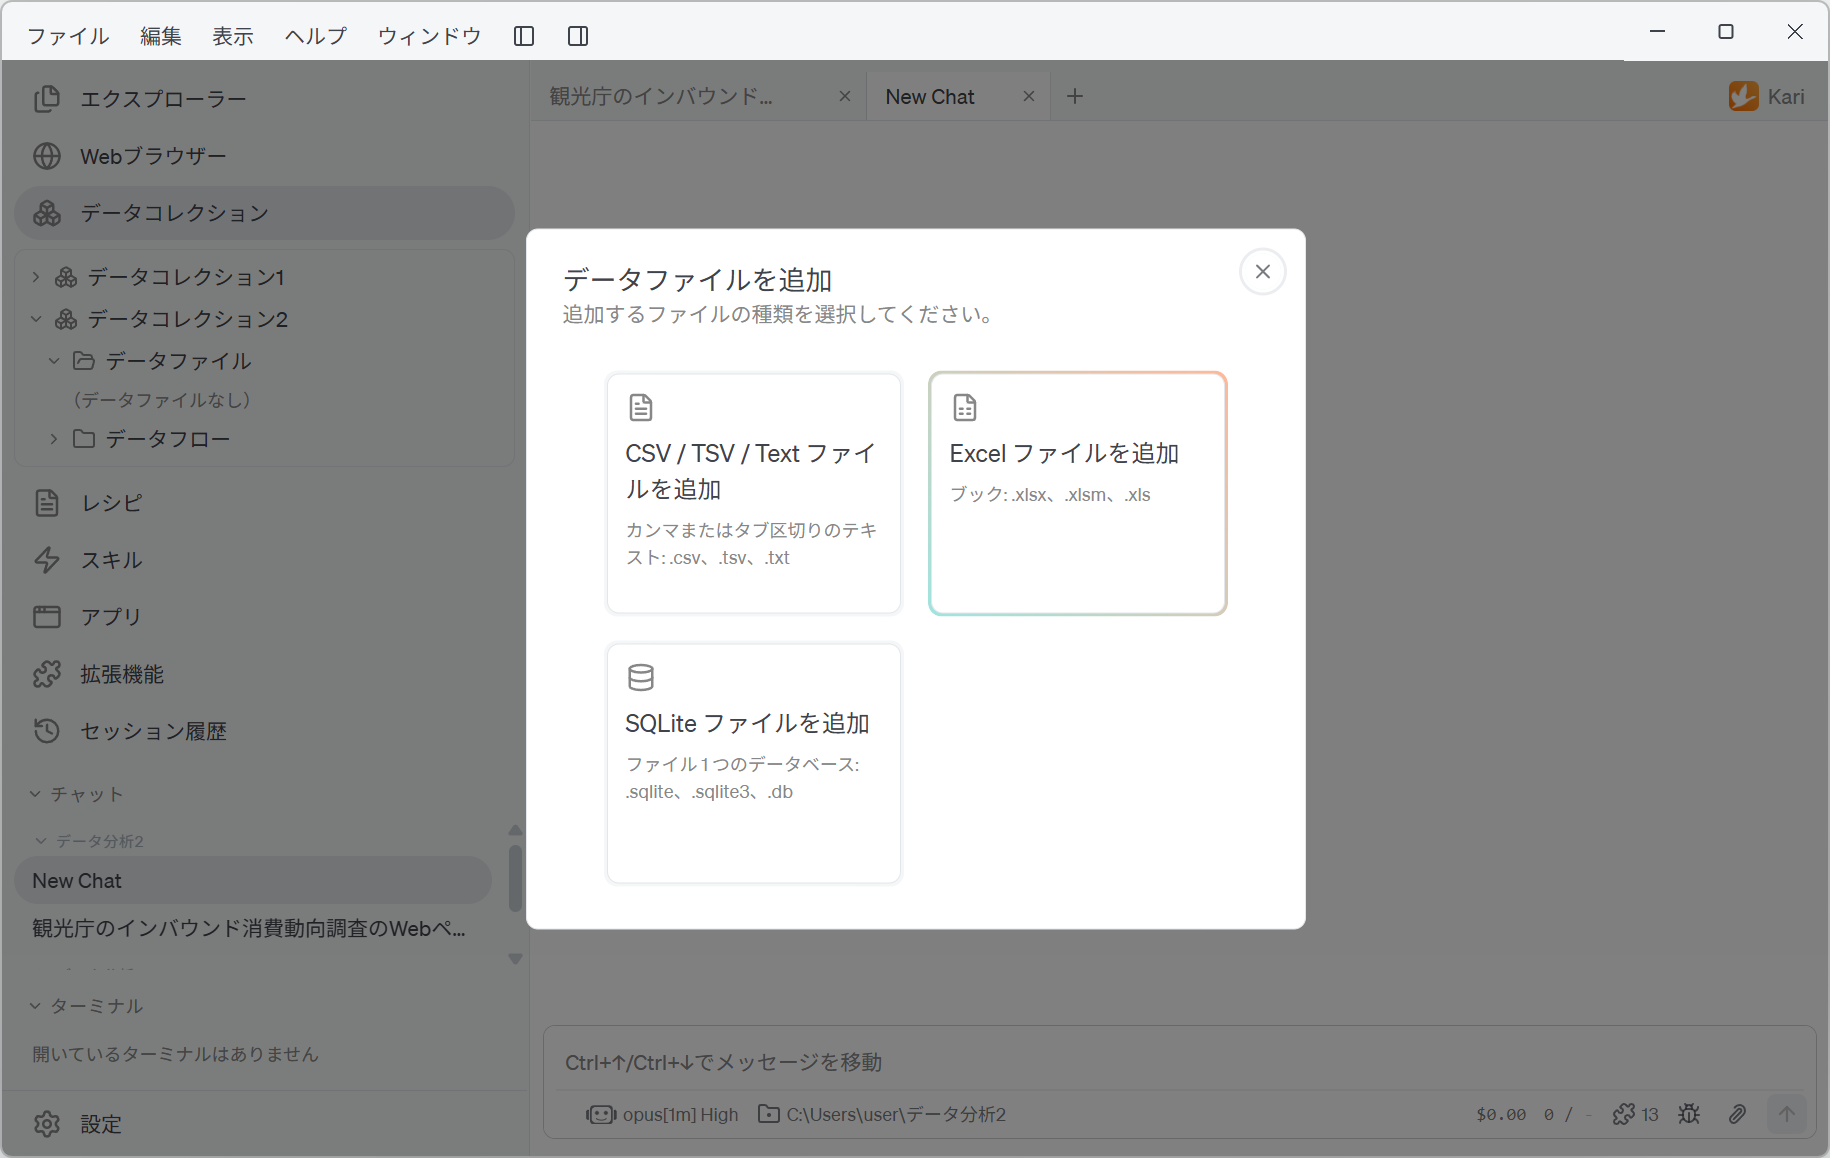
Screenshot shown in the original Japanese.
- This is how it looks with the three files added.
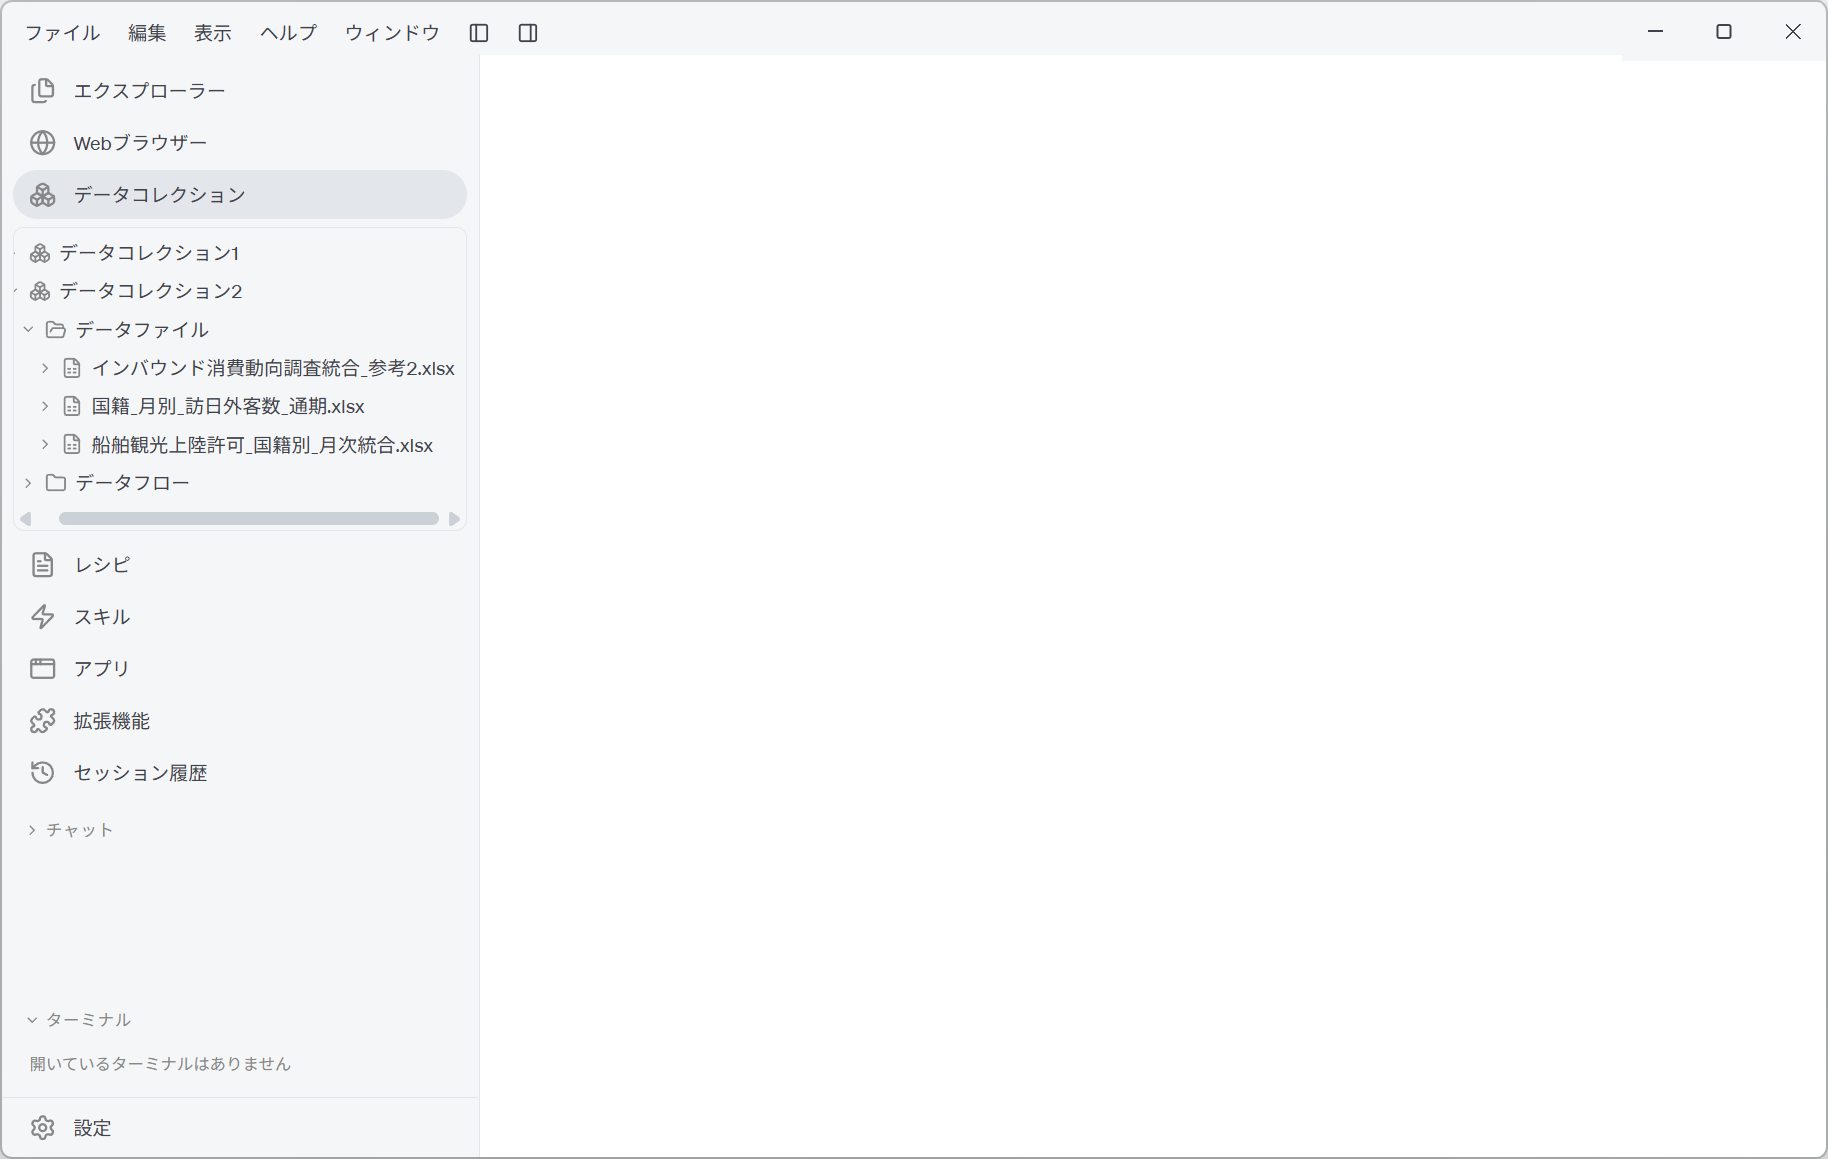
Screenshot shown in the original Japanese.
At this point there are no Tables yet. With Excel, adding a file does not create any tables. Unlike a CSV, "where the table is" can't be decided by a simple rule.
Instruct the AI to parse the files
- Right-click a Data File and choose AI Analysis.
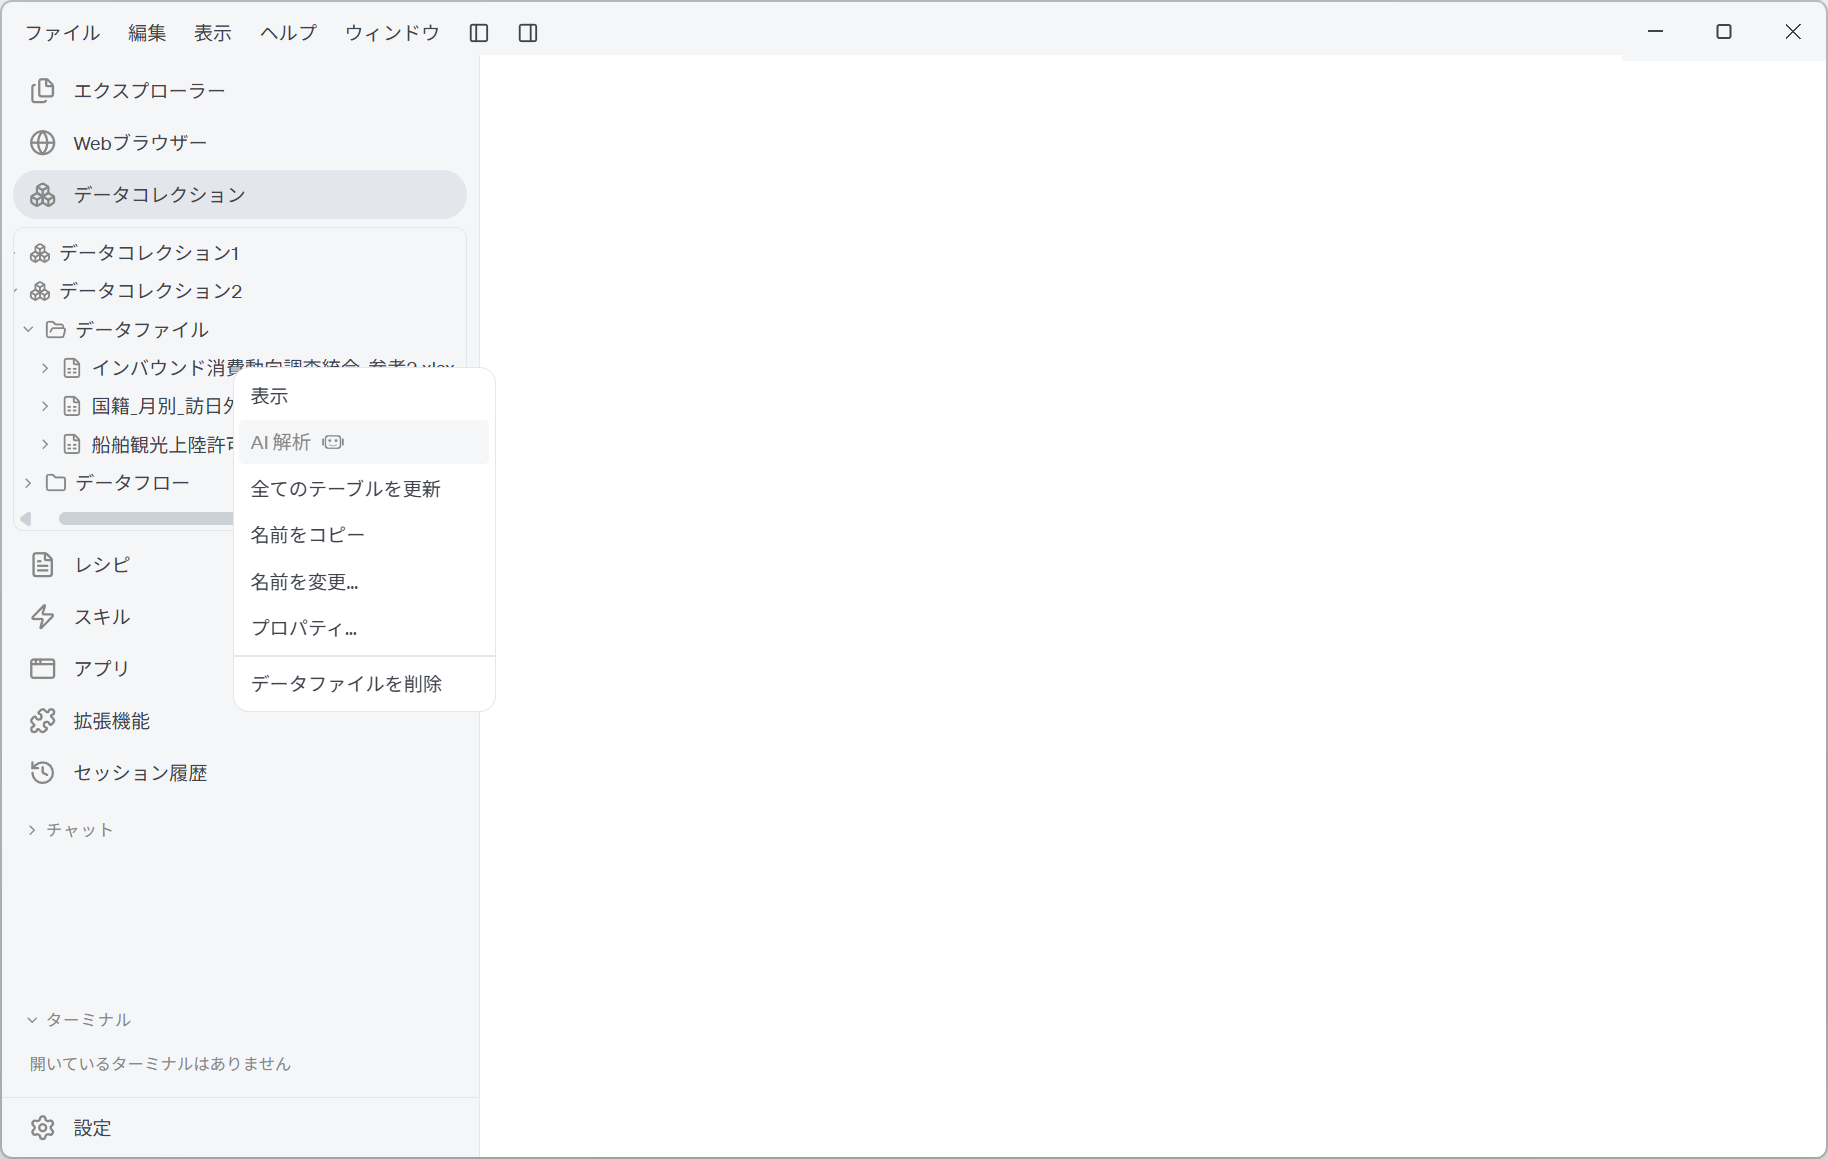
Screenshot shown in the original Japanese.
- A new chat session opens, and a prompt for Excel is filled in and sent automatically.
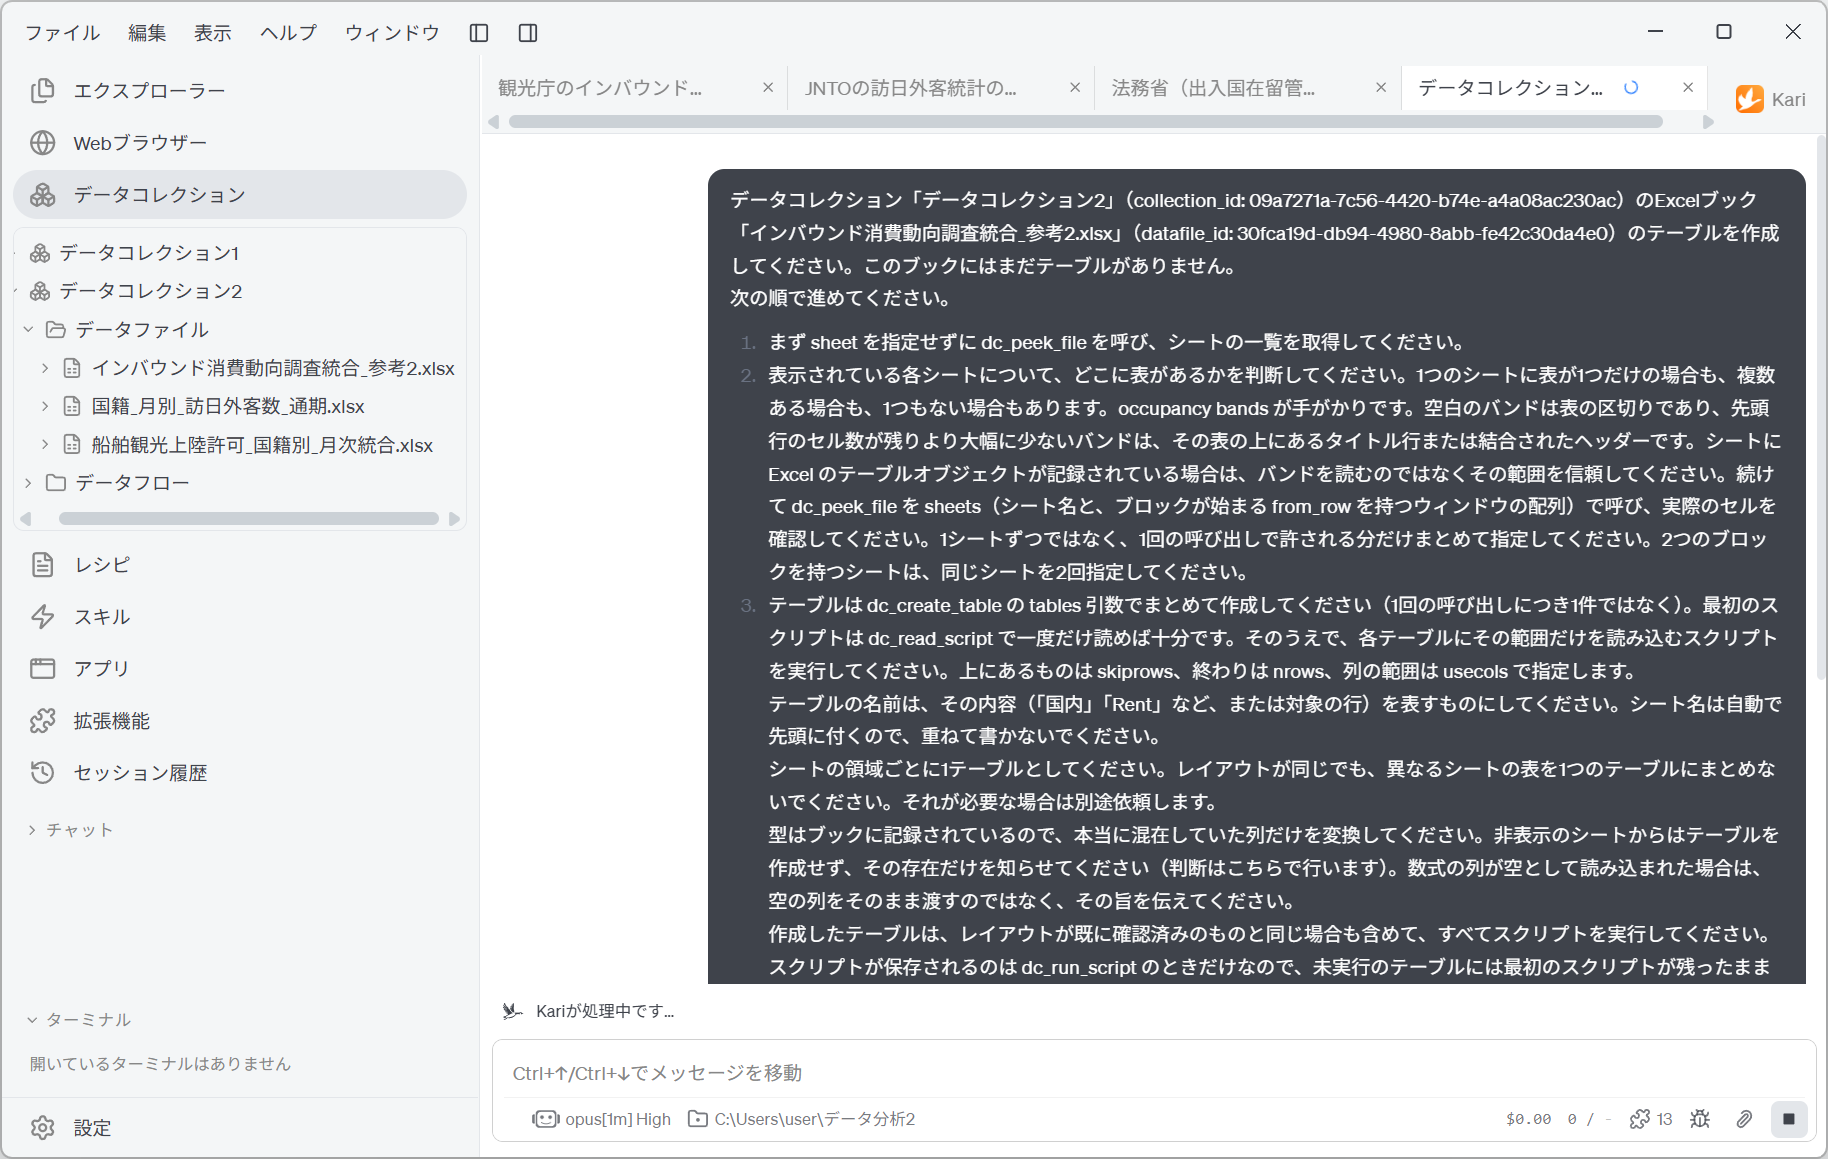
Screenshot shown in the original Japanese.
The key points of the prompt that is sent are as follows.
| Element of the prompt | Purpose |
|---|---|
First list the sheets with dc_peek_file | Makes the AI grasp the shape of the whole workbook first. It starts without even knowing how many sheets there are. |
| Judge table positions from the occupancy bands | Uses how full the cells are in each row as a clue. A blank band is a break between tables; a band whose first row has very few cells is a title row or a merged header. |
| If the workbook has Excel table objects, trust their ranges | If formal "tables" are defined in the workbook, they are more reliable than a guess. |
| Then check the actual cells | The AI is not allowed to decide on the bands alone. The prompt includes a step to look at the contents and confirm. |
| One Table per region of a sheet | If a sheet has two tables, the AI is told to create two Tables. |
| Use the workbook's types; convert only mixed columns | Excel cells carry types. The AI converts only the columns that really were mixed. |
This prompt is generated automatically for each file. Run AI Analysis on each of the three files.
Running AI Analysis discards every Table already created from that workbook. A confirmation dialog appears. If you have adjusted the script by hand and then run it again, those adjustments are lost.
Check the AI's analysis messages
- First, the combined consumption trend survey file.
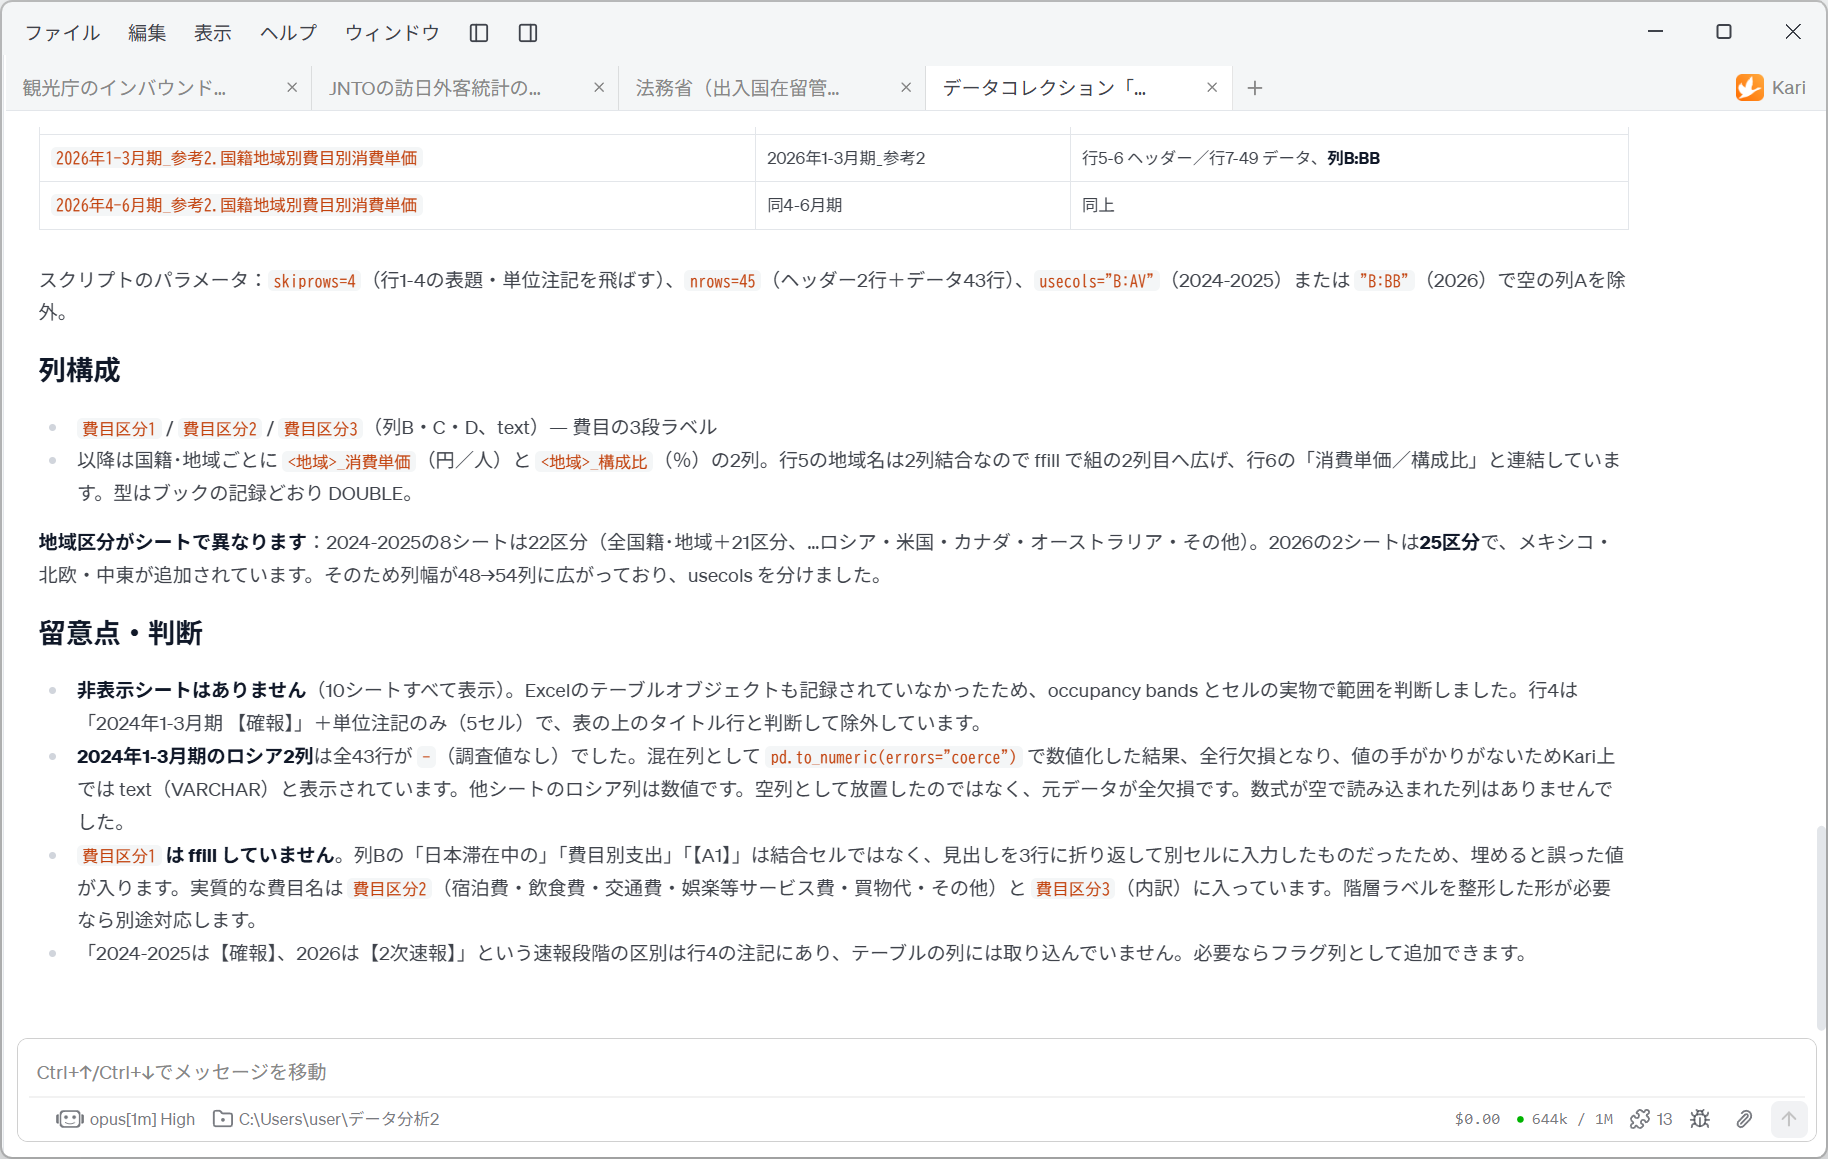
Screenshot shown in the original Japanese.
The 参考2 (Reference 2) sheets have one table per sheet. So 10 sheets = 10 Tables. The AI also reports the script parameters.
skiprows=4(skips the title and unit notes in rows 1-4),nrows=45(two header rows + 43 data rows),usecols="B:AV"(2024-2025) or"B:BB"(2026), excluding the empty column A.
The columns are made up as follows.
- The three columns
費目区分1費目区分2費目区分3hold the three-level label of the spending item, spread across columns B, C and D of the sheet - After them come two columns per nationality or region:
<地域>_消費単価(spending per person, yen/person) and<地域>_構成比(share, %) - The region names are merged across two columns in row 5, so they are extended to the second column of each pair with
ffill(forward fill) and joined with the 「消費単価/構成比」 (spending per person / share) label in row 6
A merged cell, left as it is, only puts its value in the first column. By forward-filling the same region name into the second column as well, column names such as 韓国_消費単価 韓国_構成比 (Korea) are created.
The regional breakdown differs between sheets: the eight 2024-2025 sheets have 22 categories (全国籍・地域 (all nationalities and regions) + 21 categories…). The two 2026 sheets have 25 categories, with Mexico, the Nordic countries and the Middle East added. The width therefore grows from 48 to 54 columns, so I split usecols.
The table titles themselves differ: 参考2 国籍・地域(21区分)別… (by nationality and region, 21 categories) versus (24区分)別… (24 categories). (The number in the title does not include all nationalities and regions.) When comparing across periods, match columns by header name, not by column position.
While the region names were forward-filled, the AI did not forward-fill 費目区分1.
I have not ffilled
費目区分1. In column B, 「日本滞在中の」, 「費目別支出」 and 「【A1】」 (a heading meaning "spending in Japan by item, [A1]") are not merged cells; they are a heading wrapped over three rows and entered in separate cells, so filling them would insert wrong values. The actual spending item names are in費目区分2(accommodation, food and drink, transport, entertainment and services, shopping, other) and費目区分3(breakdown).
This is where the AI treats differently two things that look alike: "merged cells" and "a heading entered with line wraps". Had it forward-filled mechanically, 費目区分1 would have been filled with meaningless values.
It also reports on type conversion.
The two Russia columns for January-March 2024 were
-(no survey value) in all 43 rows. Converting them as mixed columns withpd.to_numeric(errors="coerce")left every row missing, and with no clue about the values, Kari shows them as text (VARCHAR). They were not left as empty columns; the source data is missing entirely.
Note also that the distinction between preliminary stages, "2024-2025 are 【確報】 (final figures), 2026 is 【2次速報】 (second preliminary figures)", is in the note in row 4 and is not carried into any column of the Table.
- Next, JNTO's statistics on visitor arrivals (「訪日外客統計」).
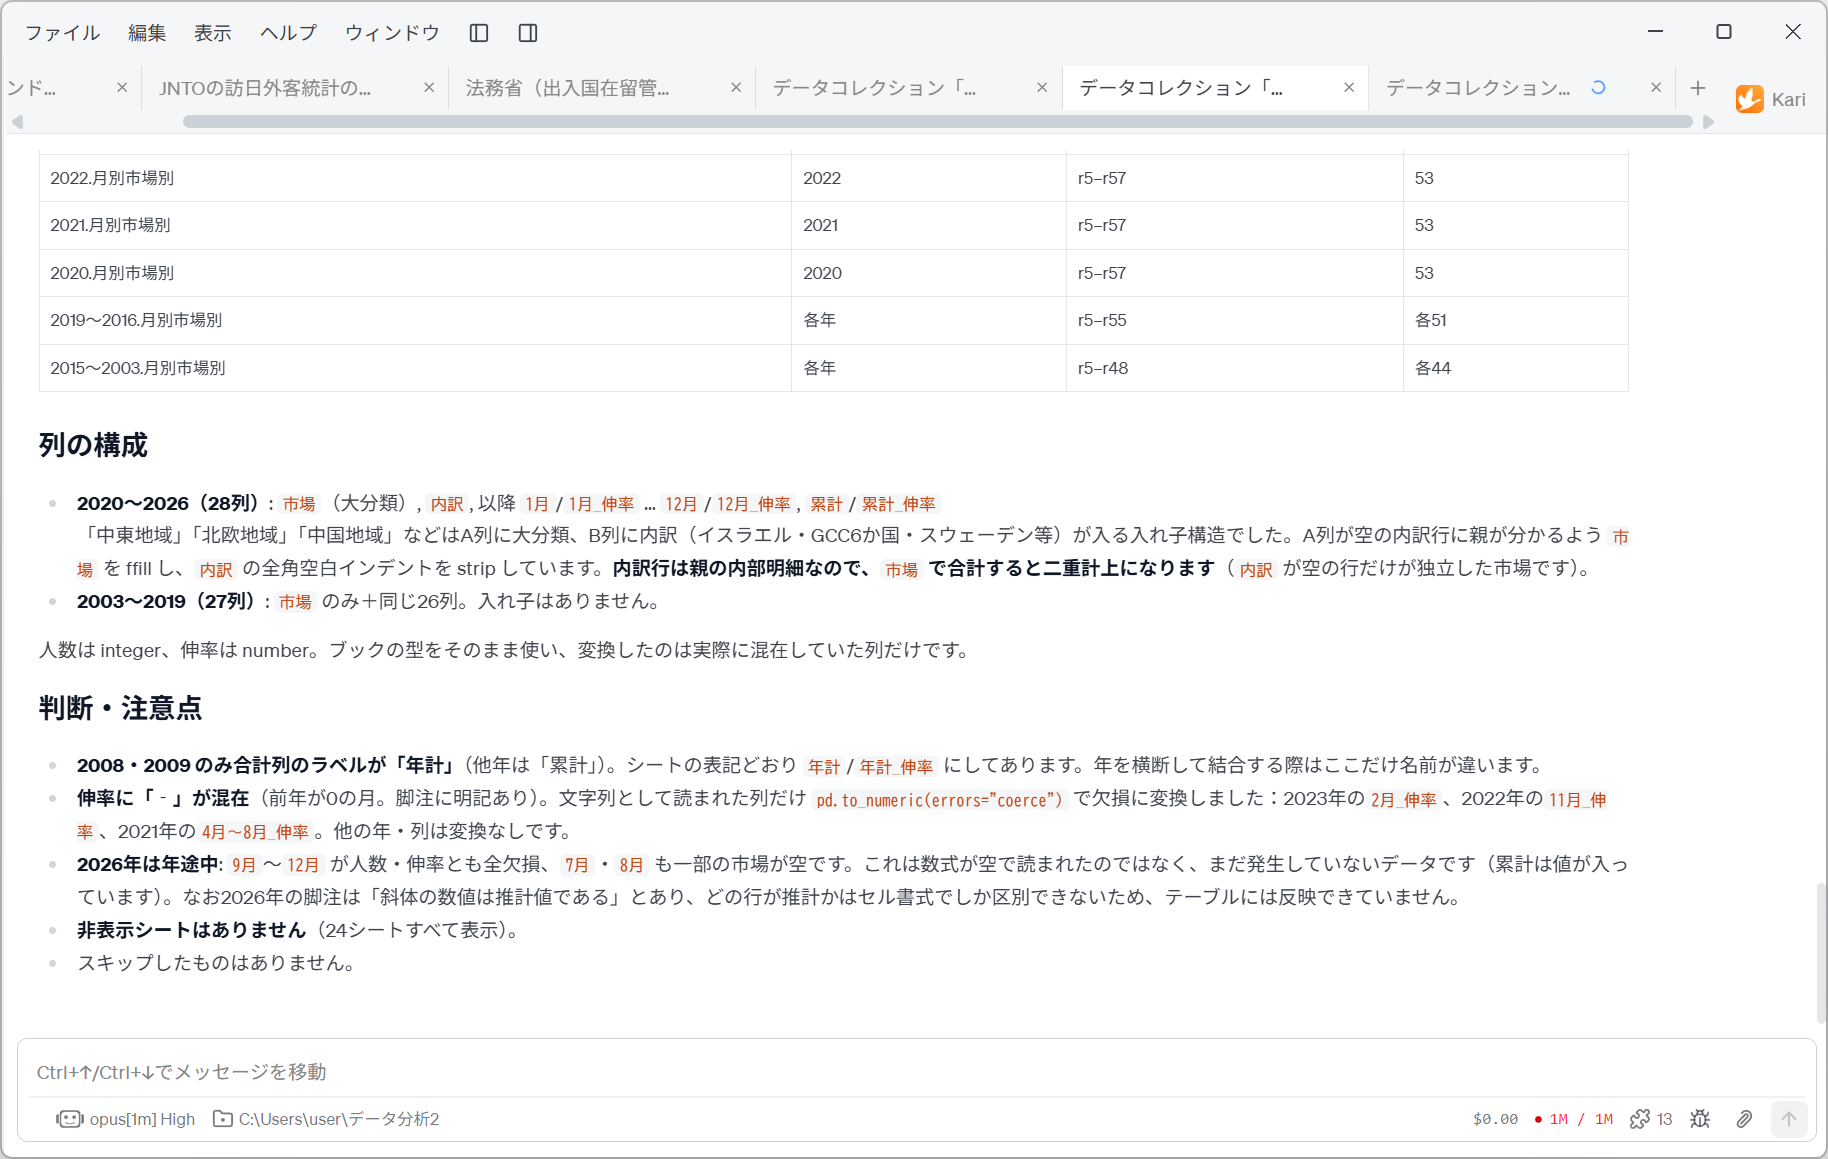
Screenshot shown in the original Japanese.
All 24 sheets are turned into tables, giving 24 Tables. The layout decision is explained row by row.
- r1 Title (「〇〇年 訪日外客数(総数)」 (visitor arrivals in year ○○, total) + source)
- r2 Blank row
- r3 Note (「*本表で…」 (in this table…) + unit)
- r4 Header (1月/伸率 …12月/伸率, 累計/伸率: each month / growth rate, cumulative total / growth rate)
- r5 onwards Data (market = total, regional totals, countries)
- Last two rows Notes (statement of source, disclaimer on final/estimated values)
This is the sentence most worth reading on this page.
On the occupancy bands, r3 to the end was a single band, but looking at the cells, r3 is a note, r4 is the header and the last two rows are notes, so I took the table body as starting at r5.
Judged only by how full the cells are, rows 3 to the last row look like one continuous table. But reading the contents, the top is a note and so are the last two rows. The AI overrides the band-based judgement with the actual cells. This is why the prompt says "then check the actual cells".
It further reports that the structure takes four forms depending on the year.
| Year | Label columns | Range read |
|---|---|---|
| 2026–2023 | A = market, B = breakdown | r5–r58 (nrows=54, usecols=A:AB) |
| 2022–2020 | A = market, B = breakdown | r5–r57 (nrows=53, usecols=A:AB) |
| 2019–2016 | A = market only | r5–r55 (nrows=51, usecols=A:AA) |
| 2015–2003 | A = market only | r5–r48 (nrows=44, usecols=A:AA) |
Column B, 「内訳」 (breakdown), only has values in the breakdown rows for the Middle East (Israel / Turkey / GCC six countries) and the Nordic region (Sweden / Denmark / Norway / Finland). Up to 2019 this nesting does not exist, so the column itself is absent.
Had it assumed all 24 sheets were "the same", the columns would have been misaligned for 2019 and earlier.
To express this nesting in two columns, the AI uses forward fill. It then reports how the result should be read.
I ffill
市場(market) so that breakdown rows with an empty column A show their parent, and strip the full-width space indent from内訳. Breakdown rows are internal detail of their parent, so summing by市場double-counts them (only rows with an empty内訳are independent markets).
This one sentence settles which rows to use when aggregating. It comes into play on the data joining page.
It also lists small differences to watch when working across years.
-
Only 2008 and 2009 label the total column 「年計」 (annual total) (other years use 「累計」, cumulative total). The labels follow the sheets, so this is the one place where the name differs when joining across years
-
2026 is a partial year: September to December are missing for both visitors and growth rate, and some markets are empty for July and August too. These are not formulas read as empty; the data does not exist yet
-
The distinction in the 2026 footnote, "figures in italics are estimates", can only be told from the cell formatting, so it is not reflected in the Table
-
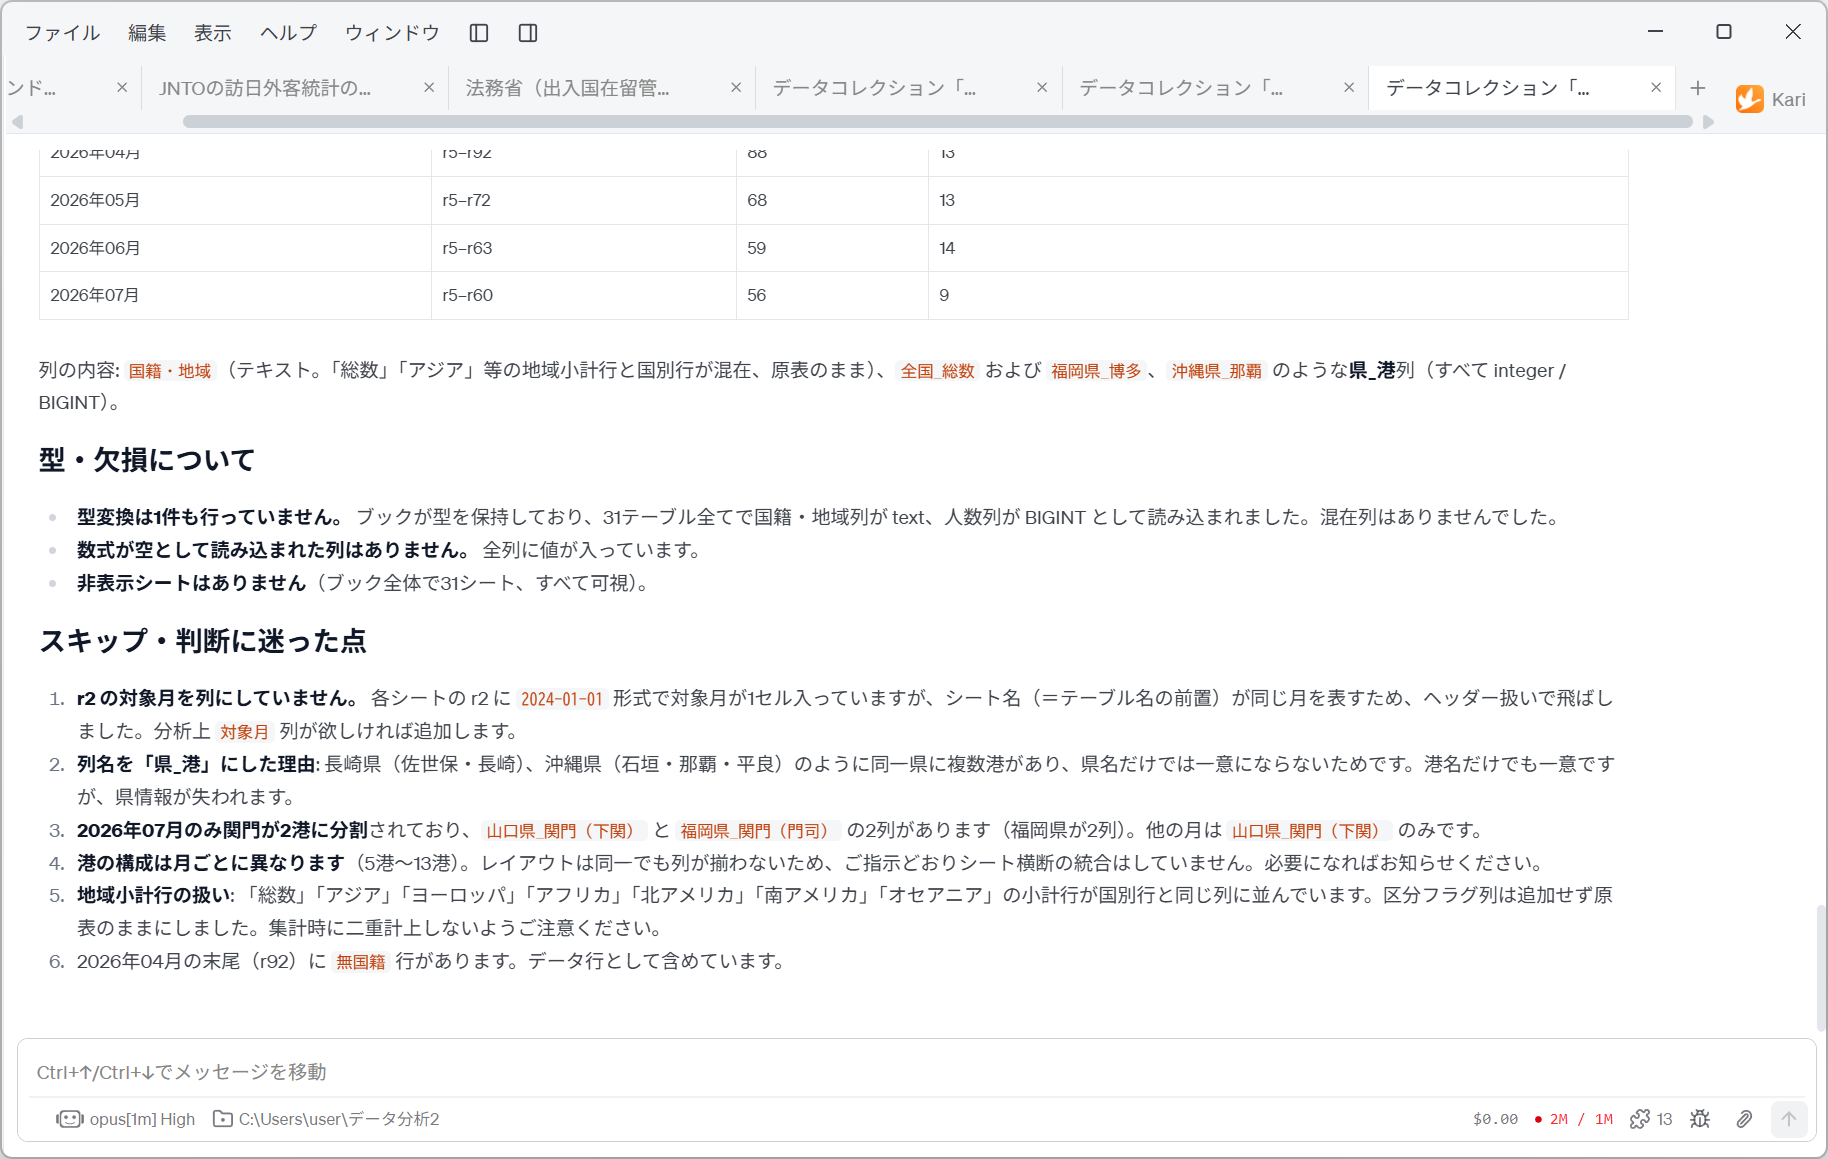
Finally, the combined cruise passenger file.
Screenshot shown in the original Japanese.
All 31 sheets are turned into tables, giving 31 Tables. The range read and the row and column counts are listed for each month.
The columns are made up as follows.
国籍・地域(nationality and region; text. Regional subtotal rows and country rows are mixed, as in the original table — 「総数」 (total), 「アジア」 (Asia) and so on),全国_総数(national total), and県_港(prefecture_port) columns such as福岡県_博多(Fukuoka_Hakata) and沖縄県_那覇(Okinawa_Naha) (all integer / BIGINT).
It also explains why the columns are named 県_港.
Because some prefectures have several ports, so the prefecture name alone is not unique, as with Nagasaki (Sasebo, Nagasaki) and Okinawa (Ishigaki, Naha, Hirara). The port name alone would be unique, but the prefecture information would be lost.
The set of ports differs by month (5 to 13 ports). Even with the same layout the columns don't line up, so, as you instructed, I have not combined the sheets.
It also reports an exception affecting a single month.
Only in July 2026 is Kanmon split into two ports, with two columns,
山口県_関門(下関)(Yamaguchi_Kanmon (Shimonoseki)) and福岡県_関門(門司)(Fukuoka_Kanmon (Moji)) (Fukuoka has two columns). Every other month has only山口県_関門(下関).
This example uses only 全国_総数, so this has no effect, but if you analyze by port, design on the assumption that the columns change from month to month.
On types, the report contrasts with that for the consumption trend survey.
I did not convert a single type. The workbook holds the types, and in all 31 Tables the nationality and region column was read as text and the visitor columns as BIGINT. There were no mixed columns.
The points the AI was unsure about are also listed.
- The target month in r2 is not made into a column. Each sheet has the target month in a single cell in r2, in the form
2024-01-01, but the sheet name (= the prefix of the Table name) represents the same month, so it is skipped as part of the header - Handling of regional subtotal rows: subtotal rows such as 「総数」 (total), 「アジア」 (Asia) and 「ヨーロッパ」 (Europe) sit in the same column as the country rows. No category flag column was added; they are left as in the original table, so take care not to double-count when aggregating
- April 2026 has a
無国籍(stateless) row at the end, which is included as a data row
Check the Tables the AI created
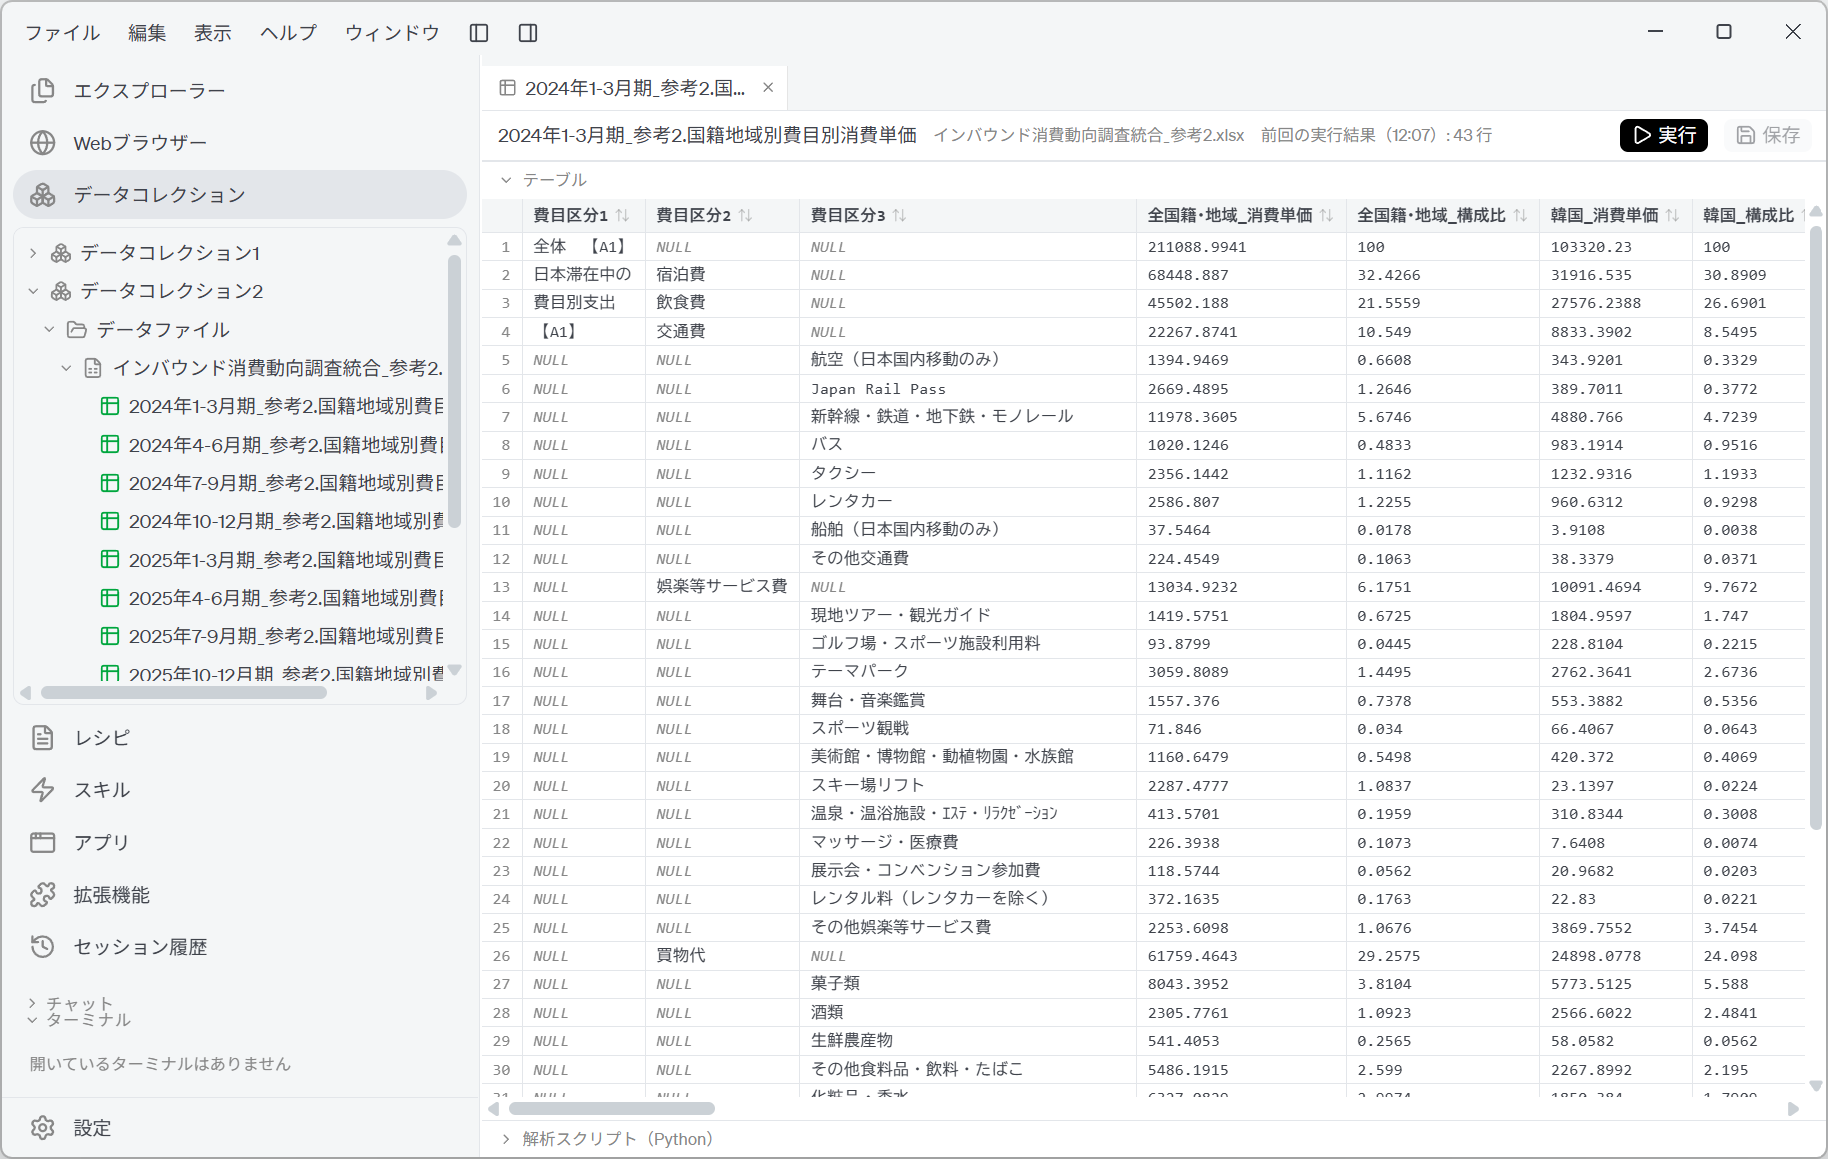
- The consumption trend survey Tables. In the tree on the left, one Table is listed per sheet.
Screenshot shown in the original Japanese.
Table names take the form 2024年1-3月期_参考2.国籍地域別費目別消費単価: the sheet name followed by a content name the AI has given it.
Open a Table and you see the three columns 費目区分1 費目区分2 費目区分3, followed by two columns per region: 全国籍・地域_消費単価 全国籍・地域_構成比 韓国_消費単価 韓国_構成比 …. The first row is 全体【A1】 (overall), with 消費単価 (spending per person) 211,088.99 yen and 構成比 (share) 100.
Look closely at the grid and the 費目区分1 column reads, from the top, 「全体【A1】」, 「日本滞在中の」, 「費目別支出」, 「【A1】」, and is NULL from row 5 onwards.
This is because in the original Excel file a tall heading is wrapped over three rows and entered in separate cells. As seen in the previous section, the AI did not forward-fill here, because filling would insert wrong values.
The actual spending item names are in 費目区分2 (accommodation, food and drink, transport, entertainment and services, shopping, other) and 費目区分3 (their breakdown). This example uses the 全体 (overall) row and the rows for the six main spending items, so there is no occasion to use 費目区分1 as a category.
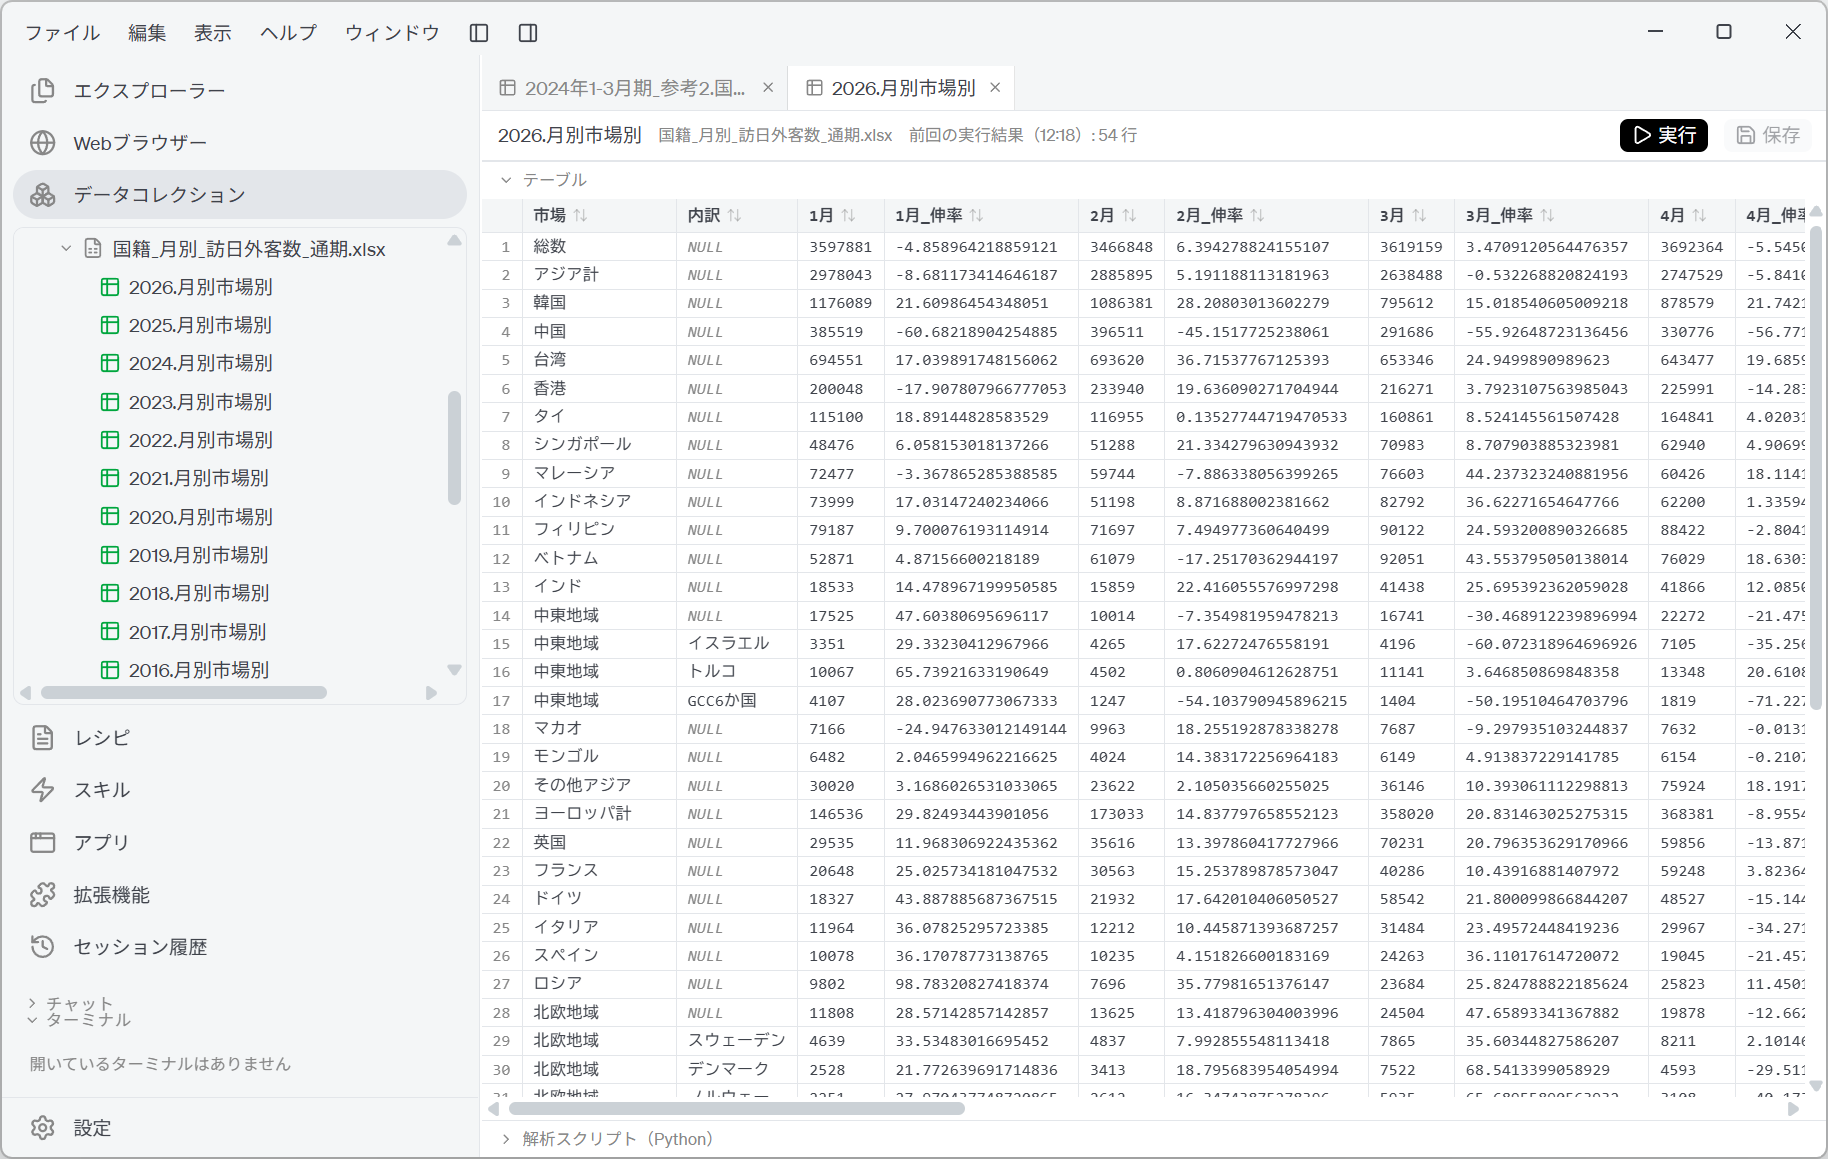
- The visitor arrivals Tables. One per year, 24 in all.
Screenshot shown in the original Japanese.
Table names take the form 2026.月別市場別 (by month and market), with the year as the prefix of the Table name. The columns are 市場〔, 内訳〕, 1月, 1月_伸率, …, 12月, 12月_伸率, 累計, 累計_伸率 (market [, breakdown], each month and its growth rate, cumulative total and its growth rate). Visitor numbers are integer and growth rates are number.
In the grid, 総数 (total), アジア計 (Asia total), 韓国 (Korea) … are listed in the 市場 column, with 内訳 NULL. Only 中東地域 (Middle East) in row 14 represents a regional total with 内訳 left NULL; in the three rows that follow, 市場 stays 中東地域 while 内訳 holds イスラエル (Israel), トルコ (Turkey) and GCC6か国 (GCC six countries). The nested structure is expressed in two columns.
There is also an important report on type conversion.
What actually mattered were the growth rate columns for 2021–2023, which contained cells where "the growth rate is shown as 『-』 because the previous year was 0". This 『-』 becomes missing (NULL) — it means "cannot be calculated", not 0%, so take care when aggregating.
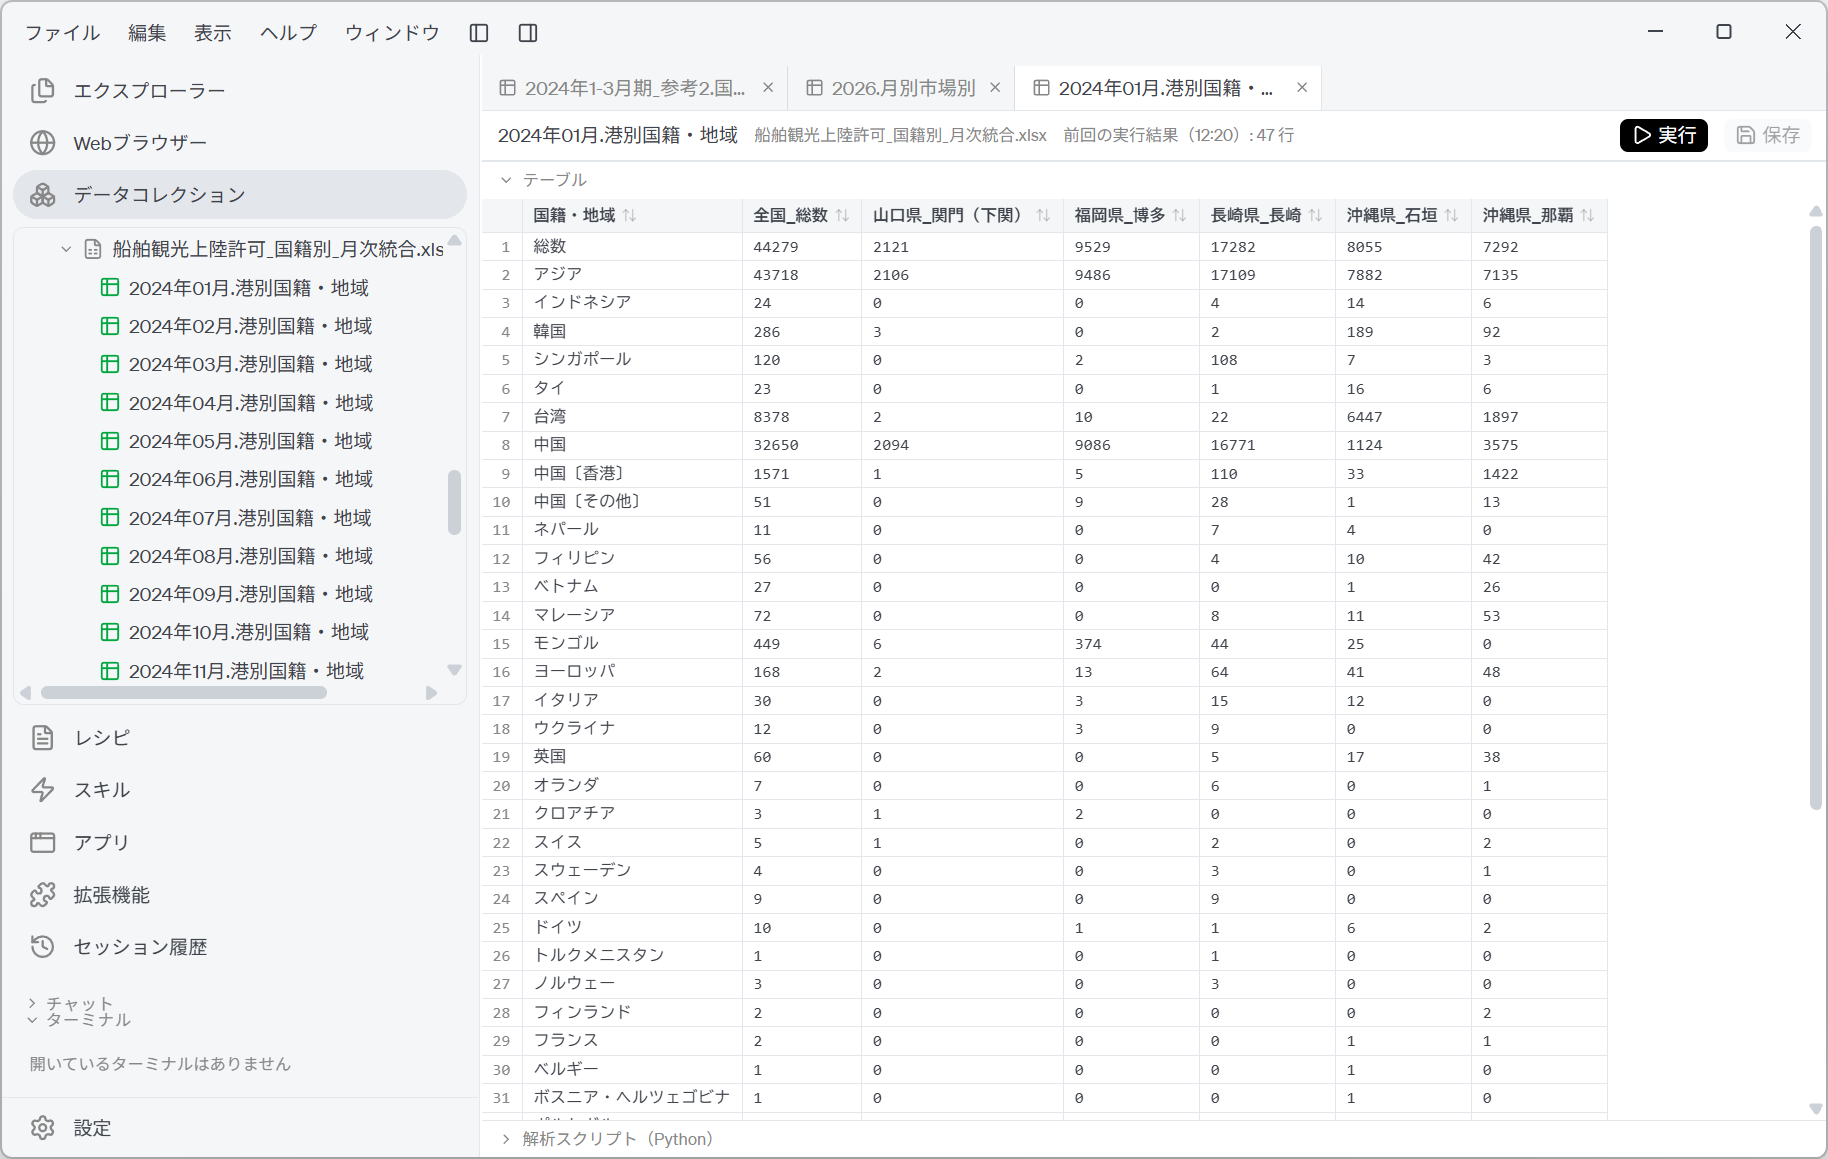
- The cruise passenger Tables. One per month, 31 in all.
Screenshot shown in the original Japanese.
2024年01月 2024年02月 … (January 2024, February 2024 …): the month is the prefix of the Table name. The columns are 国籍・地域, then 全国_総数, followed by 県_港 columns such as 福岡県_博多 沖縄県_那覇.
In the grid, 総数 (total) and アジア (Asia) are followed by インドネシア (Indonesia), 韓国 (Korea), シンガポール (Singapore) … in the same 国籍・地域 column. Total rows and individual countries are mixed, the same structure as the visitor arrivals statistics.
The cruise passenger data is broken down as 中国 (China), 中国〔香港〕 (China [Hong Kong]), 中国〔その他〕 (China [other]) and so on, which differs in both labelling and granularity from JNTO's 中国 (China) and 香港 (Hong Kong).
Mapping one to the other is covered on the data joining page.
Human-in-the-loop points
Don't leave everything to the AI; have a person check the following.
-
Count the Tables and check they match what you expect
参考2has one table per sheet, so there should be 10 Tables; the visitor arrivals statistics should give 24 Tables and the cruise passenger data 31 Tables. If the numbers don't match, the extraction of tables has failed. -
Open a few Tables to check where they were cut
The AI decides the ranges by comparing the occupancy bands with the actual cells, but the final decision is an estimate. Decisions at the edges in particular, such as "the last two rows are notes", are worth opening one Table to check by eye. If a note has slipped into the last row, the aggregated figures will be wrong. -
Check on the assumption that the structure differs by sheet
The consumption trend survey adds three categories from 2026, the visitor arrivals statistics change the number of label columns by year, and the cruise passenger data changes its port columns by month. Even if the AI reports that "all sheets are the same", read its reasons. -
Check what "-" means
The same "-" can be read as "not applicable" in one file and "cannot be calculated" in another. Even if both look the same as NULL, they need to be distinguished when aggregating. Whether you may exclude them when taking an average, or should treat them as 0, is something to decide by reading the notes in the source data. -
Inspect the hierarchical label columns
As with費目区分1, a heading entered with line wraps becomes a column as it is. Before analyzing, check whether the column is usable as a category, including whether or not the AI forward-filled it. -
Distinguish total rows from breakdown rows
In both the visitor arrivals statistics and the cruise passenger data,総数andアジア計sit in the same column as individual countries. Summing them as they are counts twice. This is the same pattern as in the population data example. -
Re-running AI Analysis is destructive
Running it again discards the existing Tables. If you have adjusted the script, keep a copy first.
Where tables are cut and how they are split into Tables vary with the LLM used. Read the AI's explanation of why it chose each range, and check the Parse script directly wherever you are not convinced.
References
The data analyzed on this page is the three sets of public data obtained on the previous page. Screenshots are reproduced as quotations with the source stated. The read ranges, column structures and types the AI decided on were generated by GotoAI as an example of Kari's operation; they were not created or published by the Japan Tourism Agency, the Japan National Tourism Organization or the Ministry of Justice.
Consumption trend data
- Material: Consumption Trend Survey for Foreigners Visiting Japan (「インバウンド消費動向調査」; formerly 「訪日外国人消費動向調査」), 「参考2 国籍・地域別 費目別1人1回当たり旅行消費単価(パッケージツアー参加費内訳含む)」 (Reference 2: travel spending per person per trip by nationality, region and spending item, including the breakdown of package tour fees)
- Provider: Japan Tourism Agency (Ministry of Land, Infrastructure, Transport and Tourism)
- URL: https://www.mlit.go.jp/kankocho/tokei_hakusyo/gaikokujinshohidoko.html
- Accessed: October 15, 2026
- Terms of use: In accordance with that website's terms of use. Source: Ministry of Land, Infrastructure, Transport and Tourism website (URL above).
Visitor arrivals data
- Material: JNTO's statistics on visitor arrivals (「訪日外客統計」), 「国籍/月別 訪日外客数」 (visitor arrivals by nationality and month; time-series tables)
- Provider: Japan National Tourism Organization (JNTO)
- URL: https://www.jnto.go.jp/statistics/data/visitors-statistics/
- Accessed: October 15, 2026
- Terms of use: Used with "Japan National Tourism Organization (JNTO)" stated as the source, as that organization requires.
Cruise passenger data
- Material: Immigration control statistics (「出入国管理統計」), 「港別 船舶観光上陸許可を受けた外国人の国籍・地域」 (nationality and region of foreign nationals granted cruise landing permits, by port; monthly tables)
- Provider: Ministry of Justice (Immigration Services Agency of Japan) / Portal Site of Official Statistics of Japan (e-Stat)
- URL: https://www.e-stat.go.jp/stat-search/files?toukei=00250011
- Accessed: October 16, 2026
- Terms of use: In accordance with that site's terms of use. Source: Ministry of Justice, 「出入国管理統計」 (Immigration control statistics).
- The external information quoted on this site is provided to illustrate examples of using Kari. This site does not guarantee the accuracy or currency of that information. Quoted sources may be changed or removed without notice.
- The AI output shown on this site was actually obtained in the stated verification environment. However, this site does not guarantee the accuracy or usefulness of that output. AI output varies with the LLM used, its settings, and from one run to the next.
- This example illustrates how Kari works; the figures it produces may differ from those published by the Japan Tourism Agency.
- The positions at which the AI cut the tables are estimates. Check them against the original Excel files before using them for aggregation.
- The data on this page includes preliminary figures and data for partial periods. Treat the results of the analysis as valid as of the time the data was obtained.
- Screenshots were taken with the version of Kari current at the time of writing. The display may differ in your version.
- The organizations quoted have no affiliation with, and do not endorse, this site or Kari.