Use Kari's AI agent to analyze the correlation between the growth in unit-area prices of second-hand condominiums and the rate of population change
Copyright © 2026GotoAI Inc.Based on the goose project
The steps on this page were verified in the following environment.
- Kari: version 0.7.3, Windows
- AI provider: OpenAI ChatGPT subscription
- Model: GPT-6.1 Sol High
About this page
On the previous page we worked out the price growth rate G for each ward and each set of conditions. The next question comes naturally: "Are prices rising more in the wards that are drawing people in?"
To check this, you need data from outside the real estate data. The MLIT real estate data we have used so far contains no population figures. We obtain them separately from the Tokyo Metropolitan Government's statistics, match them on the municipality name, and add the population data.
This page differs in character from the examples so far.
| Pages so far | This page | |
|---|---|---|
| Data | Inside a single file | Two sources joined |
| Unit of analysis | One transaction | One ward (only 23 points) |
| Question | What moves together with what | Does a hypothesis hold |
The second row matters most. The sample has only 23 points. The care required is entirely different from the previous pages, which handled 150,000 records. With small data of 23 points, a correlation coefficient changes easily when a single point moves.
What to watch on this page is how the AI deals with that.
Download Tokyo's population data by municipality
- First, prepare the population data. Have the AI fetch the last five years in one go from the Tokyo Metropolitan Government's statistics page. The prompts below are English renderings of the Japanese prompts shown in the screenshots; table, file, dataflow and variable names are quoted as they appear in Japanese.
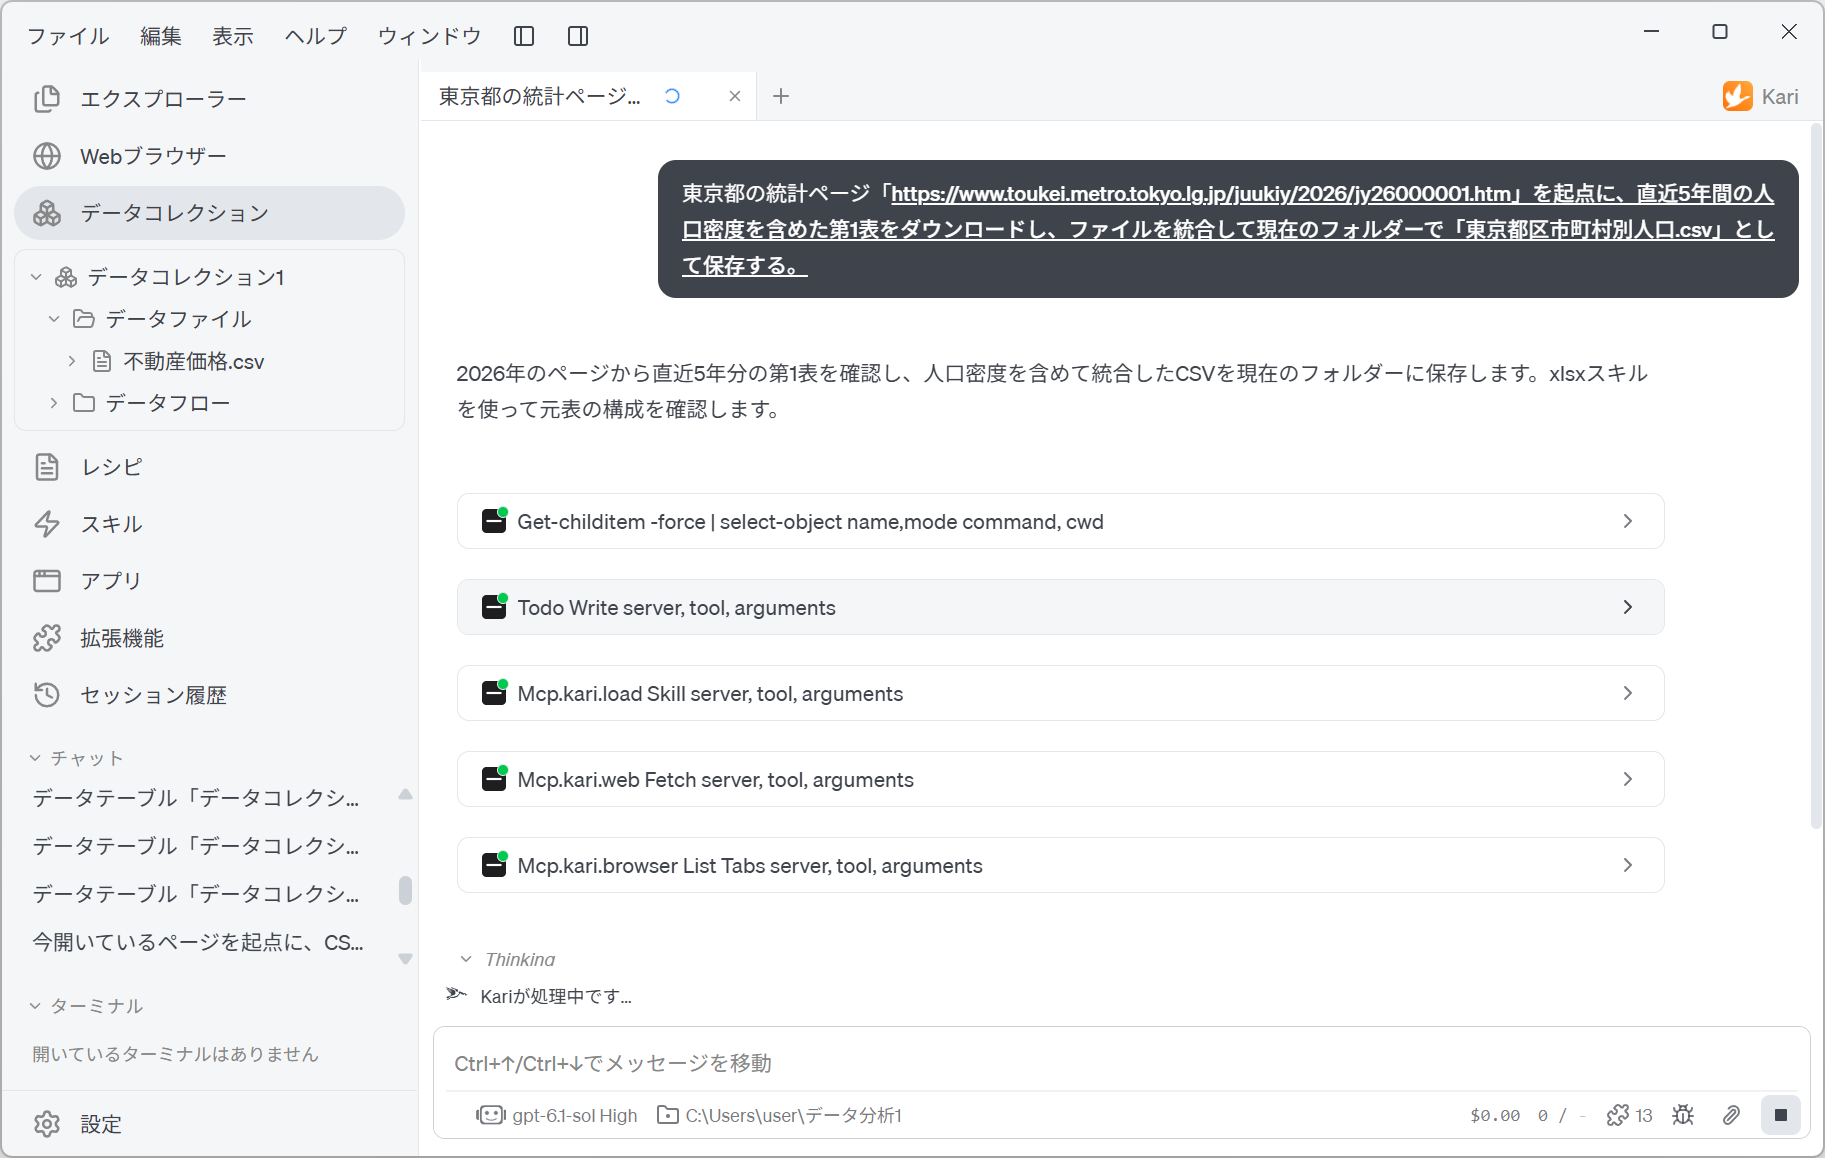
Starting from the Tokyo Metropolitan Government statistics page "https://www.toukei.metro.tokyo.lg.jp/juukiy/2026/jy26000001.htm", download 第1表 (Table 1), including population density, for the last five years, merge the files, and save the result in the current folder as 「東京都区市町村別人口.csv」.
Screenshot shown in the original Japanese.
The AI opens the page in the web browser, fetches 第1表 (Table 1), which is split by year, one year after another, and merges them into a single CSV (「東京都区市町村別人口.csv」, Tokyo population by municipality). You can see that at the start of the work it announces that it will load the xlsx skill and check the structure of the source tables.
Tokyo's statistics are published on a separate page and in a separate file for each year. If you write only "the last five years", the AI decides everything from identifying the years to merging the files. Include how many years to take and in what unit to merge them in the instruction, and nothing gets mixed up.
As in Retrieve data from MLIT's Real Estate Information Library, adding an access interval and conditions for stopping makes it safer.
Have the AI build a data table of Tokyo's population by municipality
- Add the merged CSV to the Data Collection and turn it into a Table with AI Analysis. The steps are the same as for the real estate price CSV.
Screenshot shown in the original Japanese.
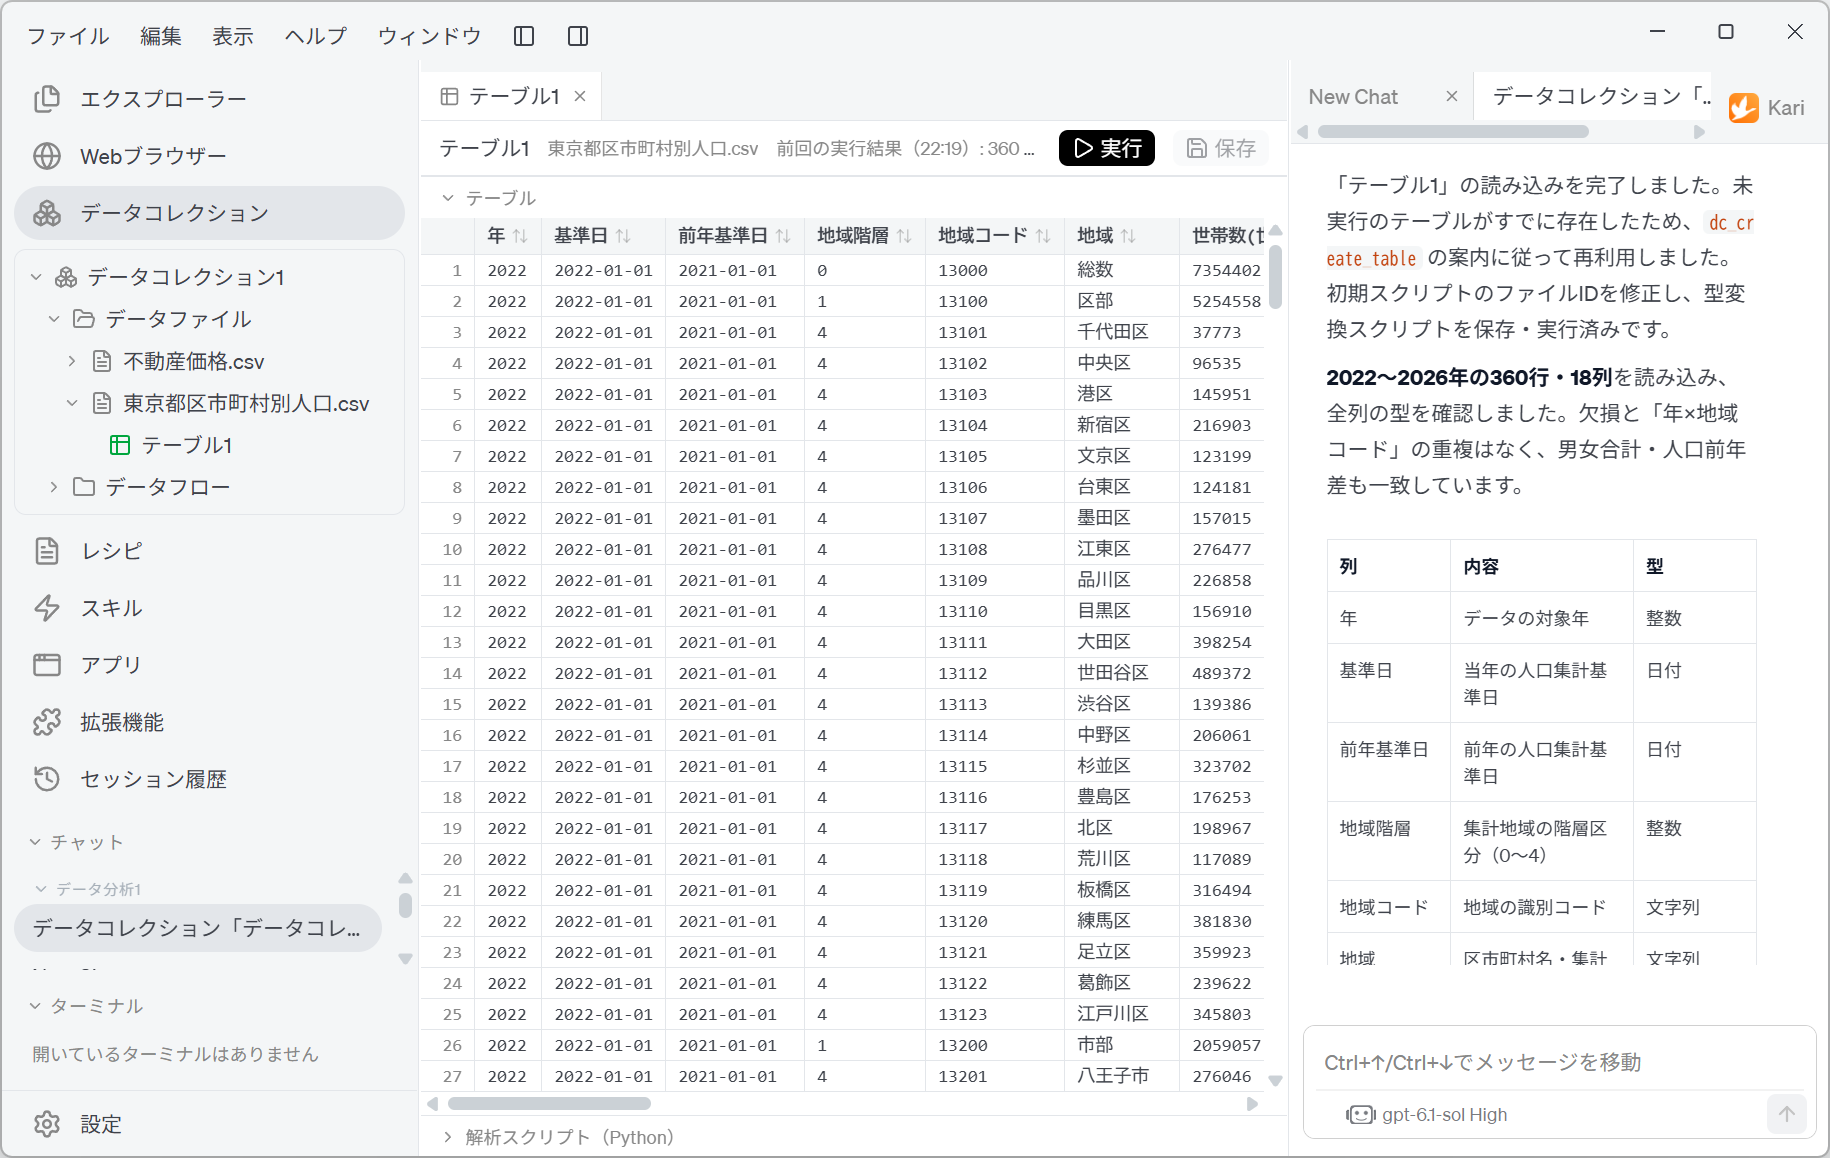
In this example, the AI reports the following.
- It read 360 rows and 18 columns for 2022 to 2026 and checked the type of every column.
- There are no missing values and no duplicate "year × area code" pairs, and the male-plus-female totals and the year-on-year population changes agree.
The table of column types shows that 「地域コード」 (area code) is a string. Not turning a local-government code such as 13101 into a number is the same decision as in Parse raw CSV data.
The population data has a column 「地域階層」 (area level), with values 0 to 4. 0 is the total, 1 is the ward area, city area and town-and-village area, and 4 is an individual ward, city, town or village. The grid shows aggregate rows mixed in, such as 「総数」 (total), 「区部」 (ward area), 「市部」 (city area), 「郡部」 (county area), 「島部」 (islands) and 「大島支庁」 (Oshima Branch Office).
To compare wards, you must use only the level-4 rows, and then narrow them to the 23 wards. Taking a correlation with the aggregate rows left in puts totals and individual values on the same footing.
Analyze the correlation between price growth and population change
- Build an average annual rate of change on both the population side and the price side, and match them ward by ward. What sets this instruction apart is that it includes the method of verification.
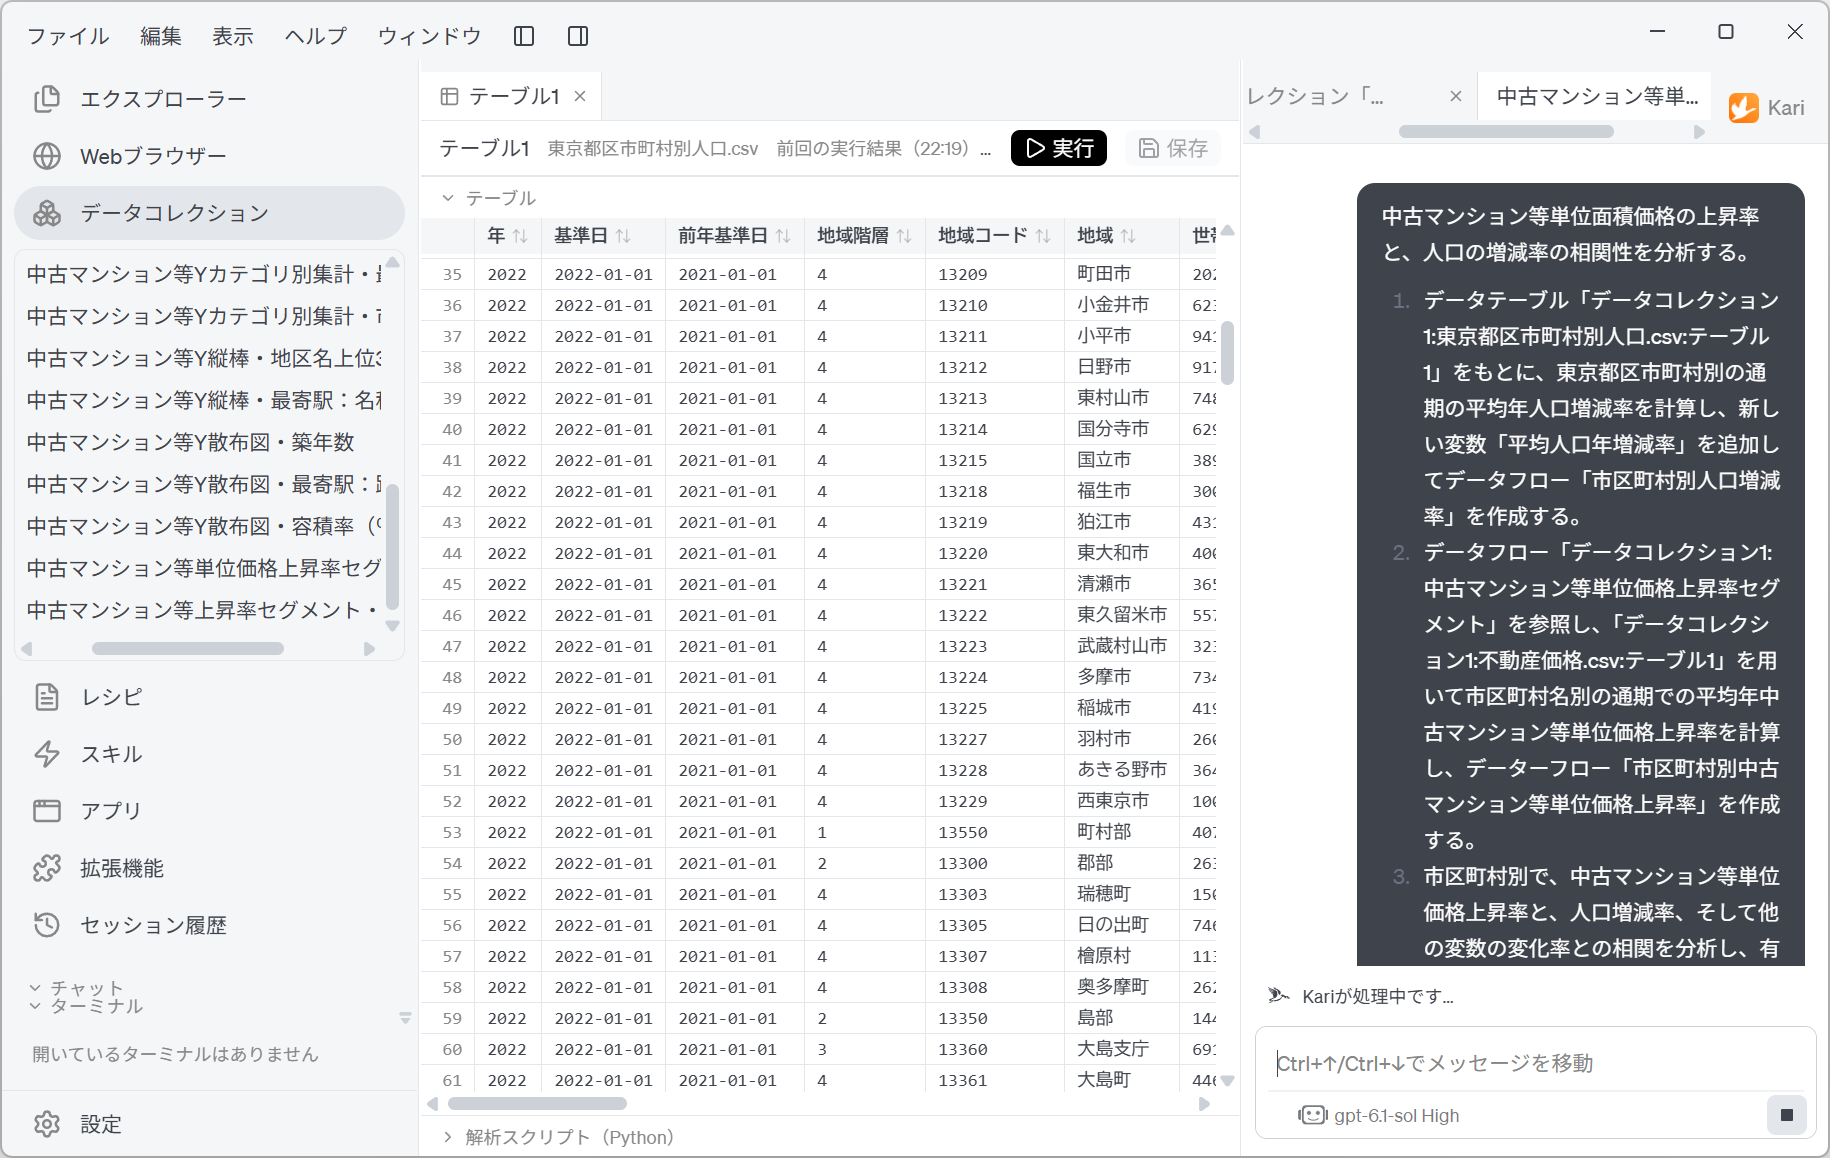
Analyze the correlation between the growth rate of the unit-area price of second-hand condominiums and the rate of population change.

1. Based on the data table 「データコレクション1:東京都区市町村別人口.csv:テーブル1」, calculate the average annual population change rate over the whole period for each ward, city, town and village of Tokyo, add a new variable 「平均人口年増減率」 (average annual population change rate), and create the dataflow 「市区町村別人口増減率」 (population change rate by municipality).
2. Referring to the dataflow 「データコレクション1:中古マンション等単位価格上昇率セグメント」, use 「データコレクション1:不動産価格.csv:テーブル1」 to calculate the average annual growth rate of the second-hand condominium unit price over the whole period for each municipality name, and create the dataflow 「市区町村別中古マンション等単位価格上昇率」 (second-hand condominium unit-price growth rate by municipality).
3. By municipality, analyze the correlation of the second-hand condominium unit-price growth rate with the population change rate and with the rates of change of other variables, calculate significance and correlation measures, and save them in the dataflow 「中古マンション等単位価格上昇率と人口増減率等の相関」 (correlation of second-hand condominium unit-price growth with population change and other variables).
4. Create a scatter plot of the population change rate and the price growth rate.
5. Based on the dataflows created, consider the correlation between the second-hand condominium unit-price growth rate and the population change rate and other variables, and output the verdicts, insights and so on in the chat.
Screenshot shown in the original Japanese.
The way this instruction is put together has a few key points.
| Block of the instruction | What it is for |
|---|---|
| 1-2. Put both sides in the same form | Both population and price are converted into the same form, the "average annual rate of change over the whole period". If one side is cumulative and the other annual, they cannot be compared. |
| 2. Refer to the existing dataflow | Referring to the previous page's 「中古マンション等単位価格上昇率セグメント」 (second-hand condominium unit-price growth segments) makes the AI carry over the definition of G. If the AI rewrites the definition, the figures will no longer match the previous page. |
| 3. Other variables as well | The AI analyzes the rates of change of other variables at the same time, not only population. Look at population alone and population appears to have a special effect. Only with something to compare against can you see where it stands. |
| 3. Significance and correlation measures | The AI reports p-values and confidence intervals, not just correlation coefficients. With 23 points a correlation easily appears by chance, so without these you cannot judge. |
| 4. Scatter plot | A coefficient alone does not tell you which points are driving it. With 23 points you can plot them all. |
| 5. Verdicts and insights | The AI is made to give a verdict on whether the result is significant. If it only produces numbers, the interpretation is dumped on the reader. |
Include "significance" in the instruction. With 23 points, a correlation coefficient of around 0.4 is not unusual even when there is no relationship. Without p-values or confidence intervals, you cannot tell whether a figure of 0.6 is strong or weak.
See the relationship in a scatter plot
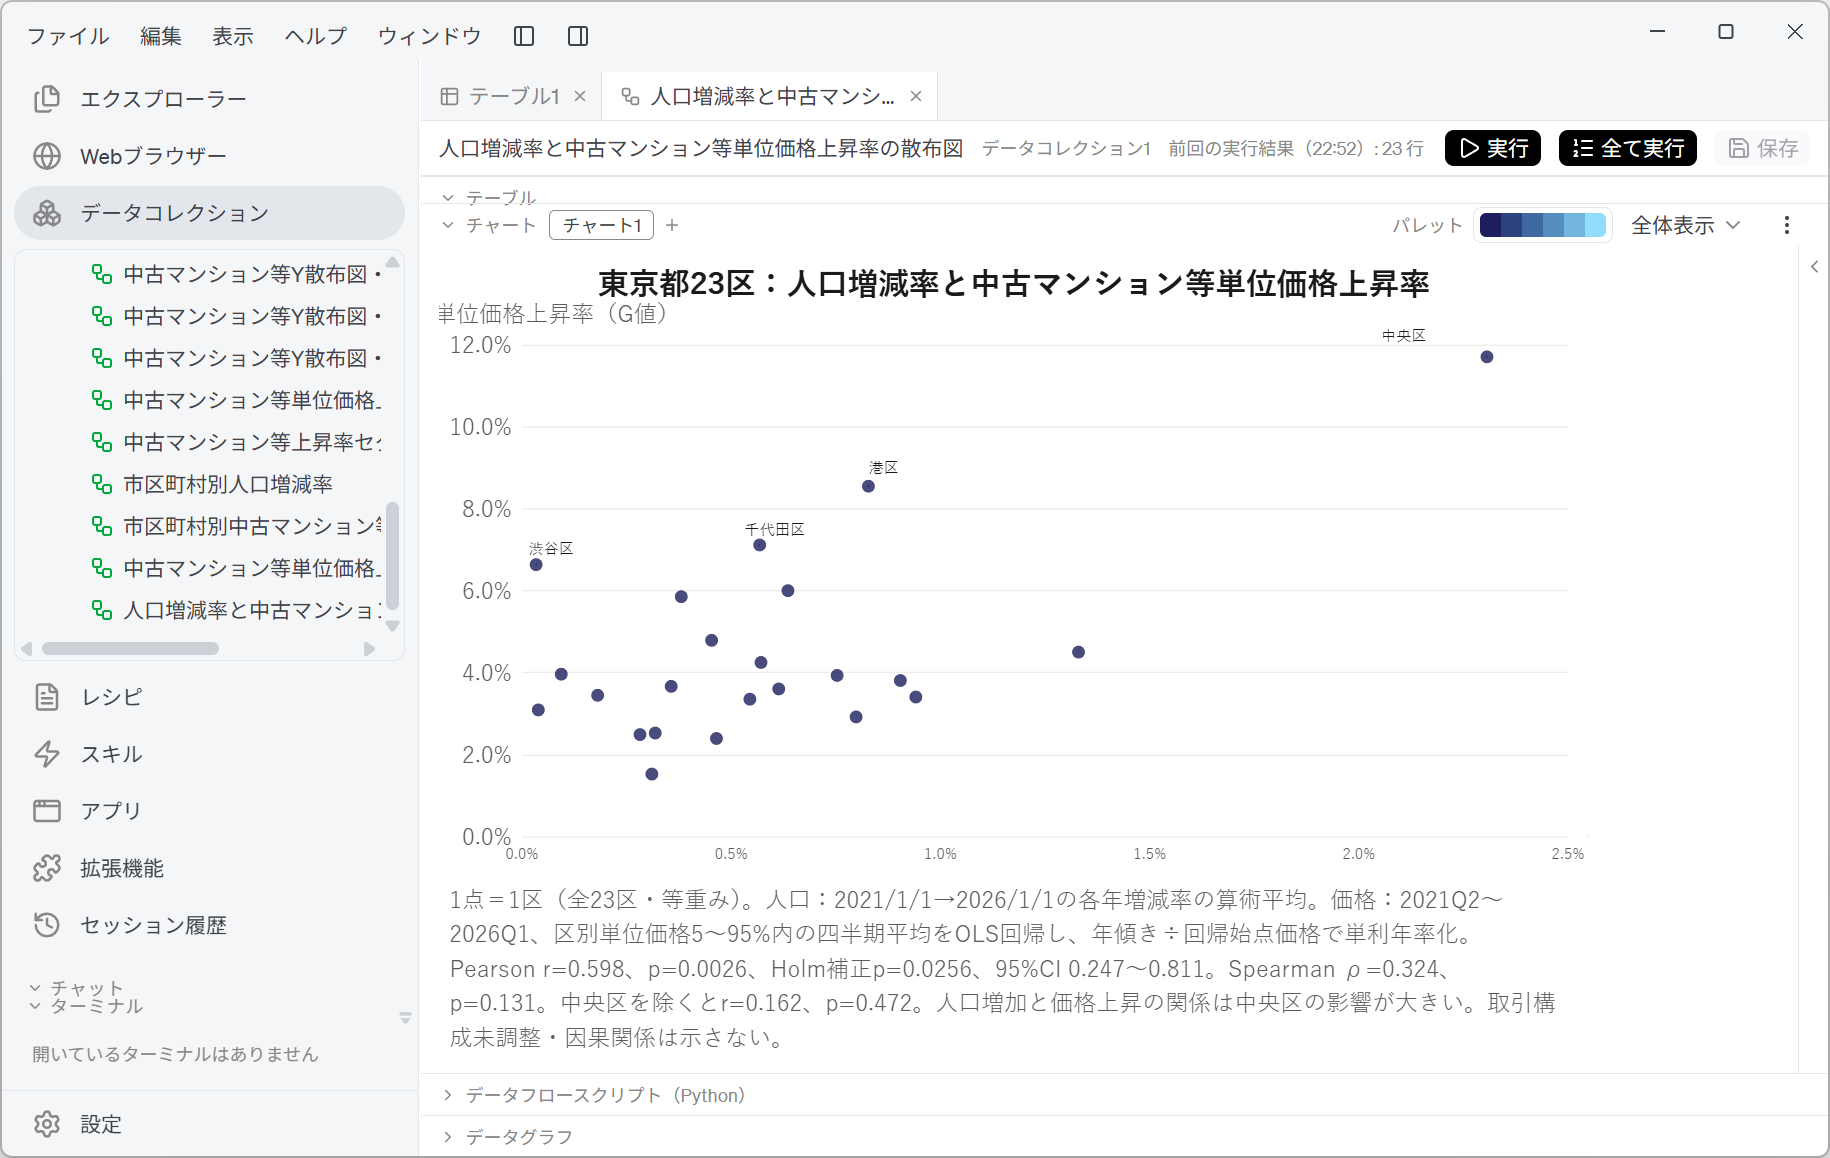
- This scatter plot shows each of the 23 wards as a single point.
Screenshot shown in the original Japanese.
In the upper right, Chuo Ward (population growth about 2.3%, price growth about 11.8%) stands out on its own. Next come Minato Ward (about 0.85%, about 8.5%) and Chiyoda Ward (about 0.6%, about 7.2%). The other 20 wards are clustered within a population change rate of 0 to 1% and a price growth rate of 2 to 6%.
Look at the left edge. Shibuya Ward's population growth is about 0.03%, practically flat, yet its price growth rate is about 6.6%, the fourth highest. Prices have risen even though the population has not grown.
The chart's note sets out the results of the verification as they are.
Pearson r=0.598, p=0.0026, Holm-adjusted p=0.0256, 95% CI 0.247 to 0.811. Spearman ρ=0.324, p=0.131. Excluding Chuo Ward, r=0.162, p=0.472. The relationship between population growth and price growth is largely driven by Chuo Ward. Transaction mix not adjusted; does not show causation.
Read the numbers after looking at the scatter plot, and their meaning becomes clear. Remove the single point in the upper right, and the correlation all but disappears.
Check the list of verifications
- The dataflow lists the results of 15 verifications.
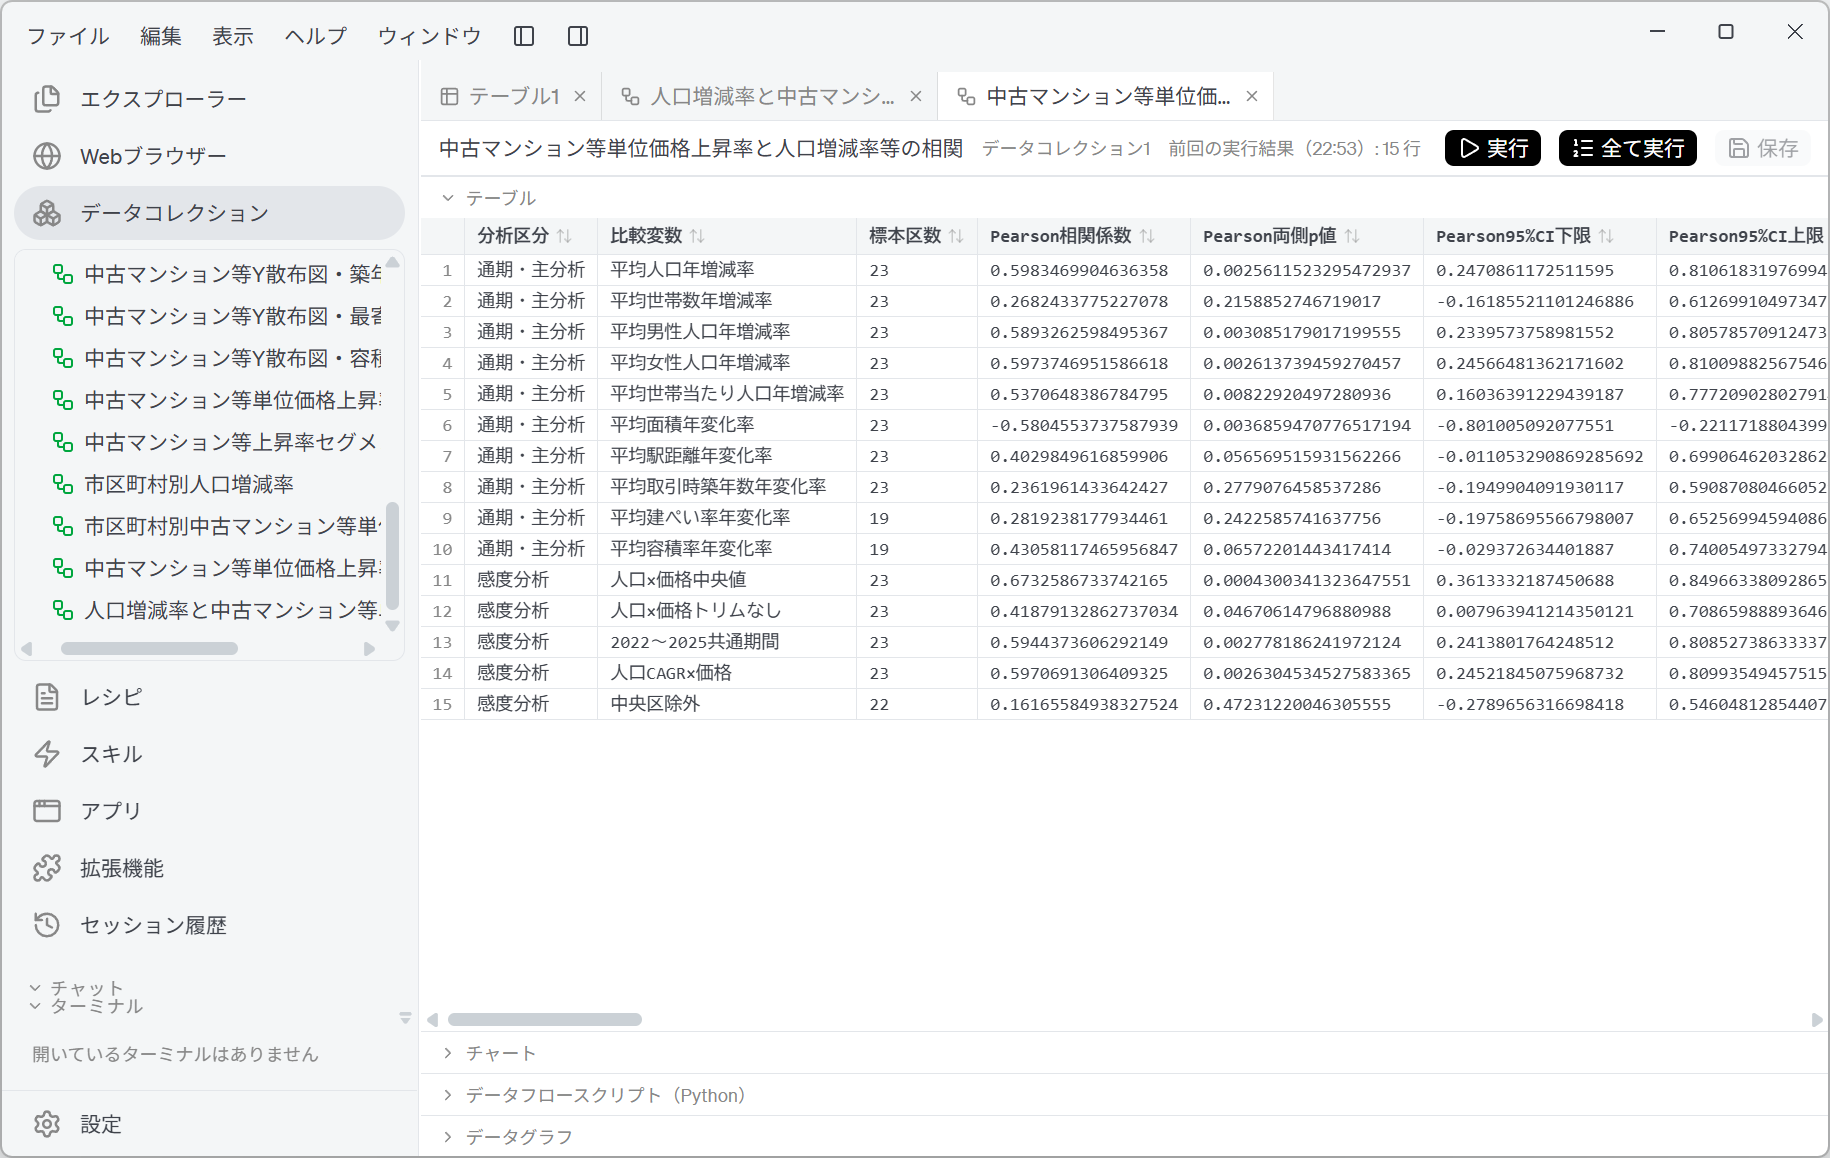
Screenshot shown in the original Japanese.
The 「分析区分」 (analysis category) column splits them into 10 「通期・主分析」 (whole period, main analysis) and 5 「感度分析」 (sensitivity analysis). A sensitivity analysis is a recalculation to check that the conclusion does not change when the conditions change.
Two results stand out in the main analysis.
| Comparison variable | Wards in sample | Pearson r | p-value |
|---|---|---|---|
| 平均人口年増減率 (average annual population change rate) | 23 | 0.598 | 0.0026 |
| 平均面積年変化率 (average annual change in area) | 23 | −0.580 | 0.0037 |
The number of households (0.268), building age at the time of transaction (0.236) and the building coverage ratio (0.282) have large p-values, and distance to the station (0.403) and the floor area ratio (0.431) are also above 0.05. Note that the building coverage ratio and the floor area ratio have a sample of only 19 wards.
And the five sensitivity analyses are the heart of this page.
| Sensitivity analysis | Wards in sample | Pearson r | p-value |
|---|---|---|---|
| Population × median price | 23 | 0.673 | 0.00043 |
| Population × untrimmed price | 23 | 0.419 | 0.047 |
| Common period 2022–2025 | 23 | 0.594 | 0.0028 |
| Population CAGR × price | 23 | 0.597 | 0.0026 |
| Chuo Ward excluded | 22 | 0.162 | 0.472 |
The first four stay within the range 0.42 to 0.67 even when the conditions change. But in the last row alone, the value drops to 0.162 and is no longer significant. All that was done was to remove one point.
The AI's verdict and discussion
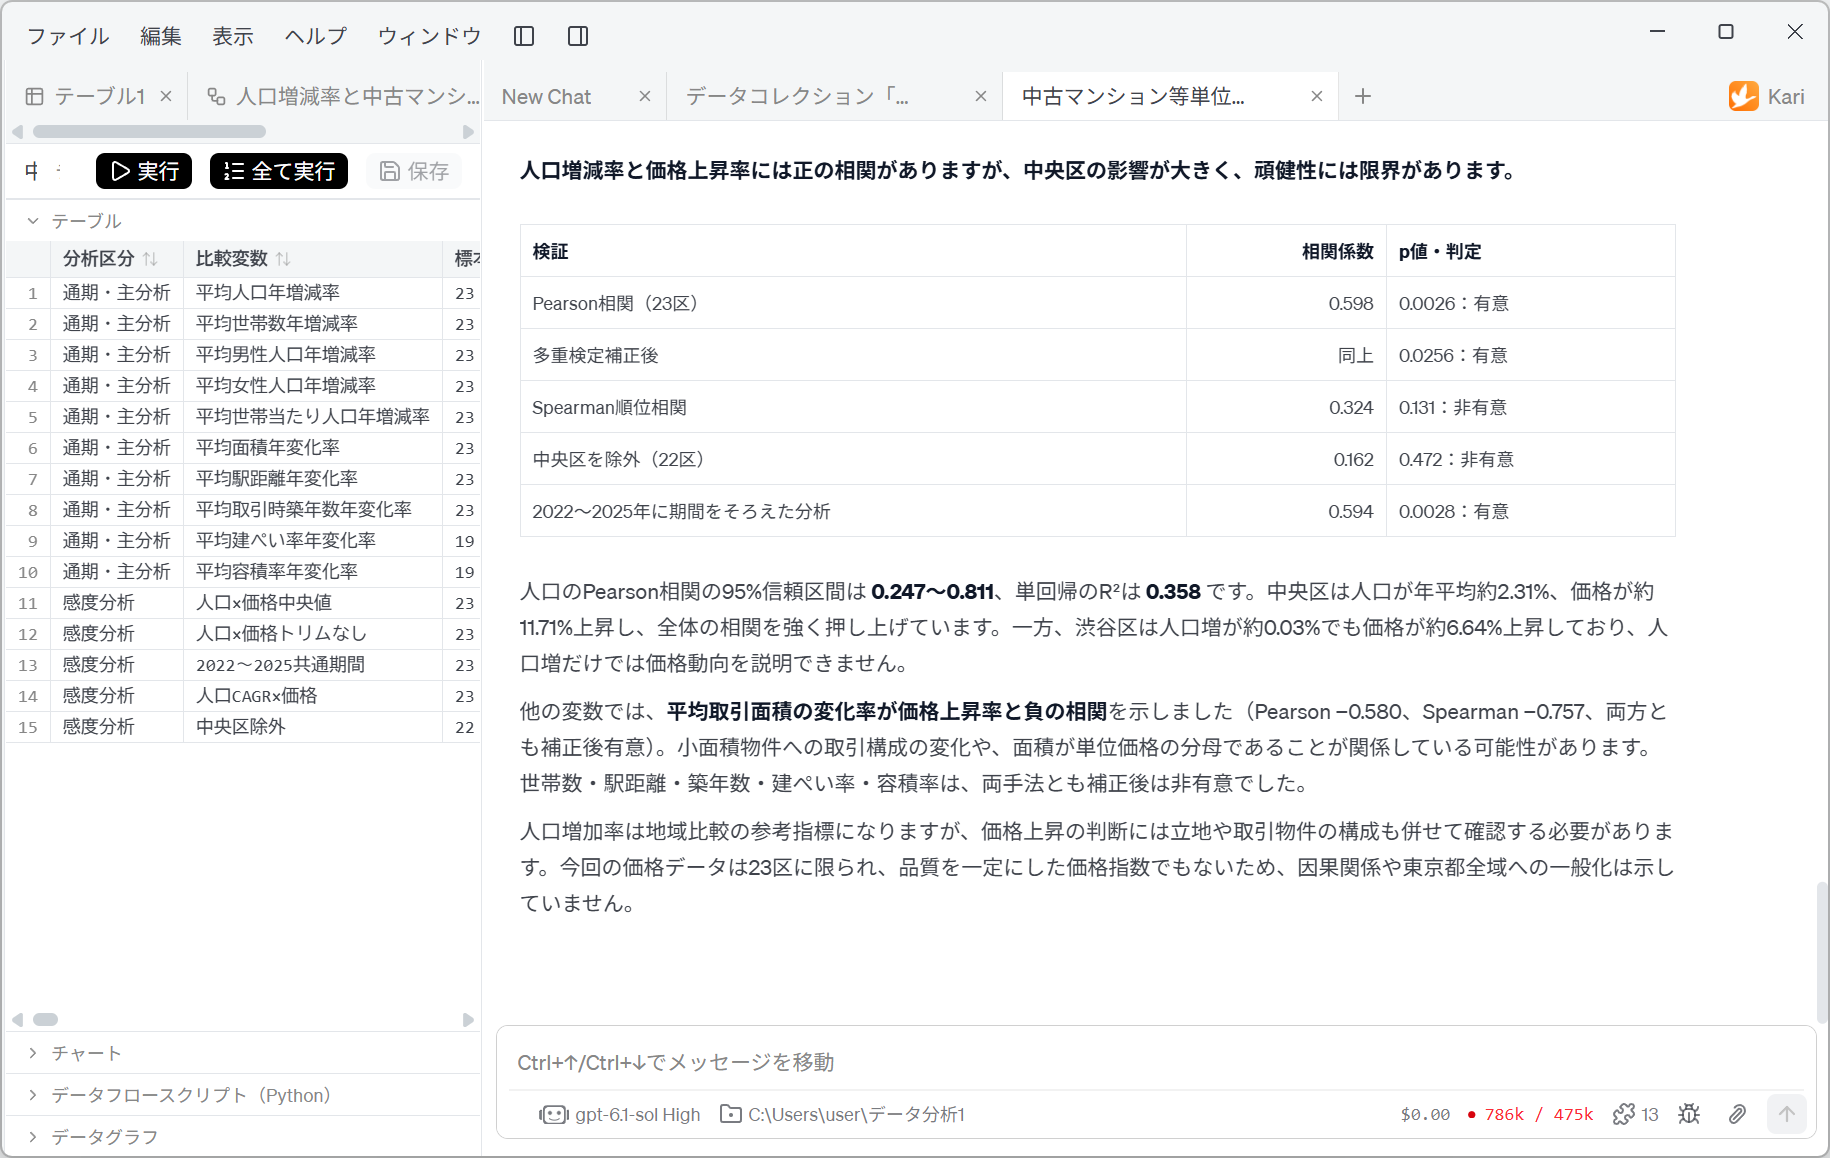
Screenshot shown in the original Japanese.
The AI's answer states its conclusion in the heading.
There is a positive correlation between the population change rate and the price growth rate, but Chuo Ward has a large influence, and the robustness is limited.
It then sums up the verdicts in a table.
| Verification | Correlation coefficient | p-value / verdict |
|---|---|---|
| Pearson correlation (23 wards) | 0.598 | 0.0026: significant |
| After multiple-testing correction | Same as above | 0.0256: significant |
| Spearman rank correlation | 0.324 | 0.131: not significant |
| Chuo Ward excluded (22 wards) | 0.162 | 0.472: not significant |
| Analysis with the period aligned to 2022–2025 | 0.594 | 0.0028: significant |
Two of the five verifications are "not significant". The AI does not line up only the convenient results.
The next paragraph explains concretely what is going on.
The 95% confidence interval of the Pearson correlation for population is 0.247 to 0.811, and the R² of the simple regression is 0.358. In Chuo Ward, the population grew by about 2.31% a year on average and prices by about 11.71%, pushing the overall correlation up strongly. Shibuya Ward, on the other hand, saw prices rise by about 6.64% with population growth of only about 0.03%, so population growth alone cannot explain price trends.
The very wide confidence interval of 0.247 to 0.811 also reflects how small the sample of 23 points is. R²=0.358 means that population change explains about 36% of the variation in price growth.
Then one more finding is reported.
Among the other variables, the rate of change in average transaction area showed a negative correlation with the price growth rate (Pearson −0.580, Spearman −0.757, both significant after correction). A shift in the transaction mix towards smaller units, and the fact that area is the denominator of the unit price, may be involved.
This is a careful point. Since Y = transaction price ÷ area, area is in the denominator. If the units being traded get smaller, Y rises even when prices do not change. The AI itself raises the possibility that the correlation comes not from market movement but from the structure of the formula.
Finally, it limits the scope.
The population growth rate is a useful reference indicator for comparing areas, but judging price growth also requires checking location and the mix of properties traded. The price data here is limited to the 23 wards and is not a quality-adjusted price index, so it does not show causation or allow generalization to the whole of Tokyo.
Human-in-the-loop points
Do not leave everything to the AI. Check the following yourself.
-
Do not forget that the sample is 23 points
This is the most important point on this page. With 23 points, moving a single point changes the conclusion. In fact, excluding Chuo Ward alone took r from 0.598 to 0.162. Do not read "r=0.6, so a strong correlation" with the same instincts as for an analysis of 150,000 records. The width of the confidence interval, 0.247 to 0.811, shows the uncertainty of the estimate as it is. -
Always look at the scatter plot before reading the coefficient
On numbers alone, "r=0.598, p=0.0026" looks like a convincing result. But the scatter plot shows at a glance that one point sits apart in the upper right. With 23 points you can plot them all. If you can plot it, plot it before you judge. -
Accept a split verdict as split
Pearson is significant, Spearman is not. Aligning the period gives significance; removing Chuo Ward does not. Picking one of them and reporting "it was significant" is wrong. The AI shows all five side by side to show that the conclusion depends on the conditions. -
Question the structure of the denominator
The rate of change in average transaction area showed a strong negative correlation of −0.580. But as long as Y = price ÷ area, Y automatically rises when area falls. This may not be a market finding but a relationship that comes from the definition of the indicator. The same care is needed here as when Y's ingredients (transaction price, area) were excluded on the correlation analysis page. -
Do not mix in aggregate rows
The population data includes aggregate rows such as 「総数」, 「区部」, 「市部」 and 「島部」. Check that only the individual wards, cities, towns and villages at level 4 are used. Mix in a total as one point, and the correlation easily comes out strong. -
Do not read rows with different sample sizes side by side
The verifications of the building coverage ratio and the floor area ratio cover 19 wards; the others cover 23. Even in the same table, the base differs. -
Do not reread correlation as causation
This data does not let you say either "prices rose because the population grew" or "people gathered in areas where prices rise". Both may be the result of the same third factor (redevelopment, for example). That population growth and price growth occur together in Chuo Ward suggests a common background in the large-scale development of the waterfront, but that is not something this data showed; it is a hypothesis to check next.
The kinds of verification carried out (whether there is a sensitivity analysis, the method of multiple-testing correction) vary with the LLM used. When you receive a report that something "was significant", always check how many things were tried, and what, to get that significance.
References
This page joins two sets of public data for its analysis. Screenshots are reproduced as quotations with the source stated. The correlation measures, verdicts and discussion that the AI produced were generated by GotoAI as an example of Kari's operation; they were not created or published by the Ministry of Land, Infrastructure, Transport and Tourism or the Tokyo Metropolitan Government.
Real estate price data
- Material: Real Estate Information Library (「不動産情報ライブラリ」), 「不動産価格(取引価格・成約価格)情報の検索・ダウンロード」 (search and download of real estate price information: transaction prices and closed-sale prices)
- Provider: Ministry of Land, Infrastructure, Transport and Tourism (MLIT)
- URL: https://www.reinfolib.mlit.go.jp/realEstatePrices/
- Accessed: October 13, 2026
- Terms of use: Subject to that site's terms of use. Source: MLIT website (URL above).
Population data
- Material: Households and Population of Tokyo based on the Basic Resident Register (「住民基本台帳による東京都の世帯と人口」), 「第1表 区市町村、世帯数、男女別人口(人口総数)及び人口密度」 (Table 1: number of households, population by sex (total population) and population density, by ward, city, town and village)
- Provider: Statistics Division, Bureau of General Affairs, Tokyo Metropolitan Government (東京都総務局統計部)
- URL: https://www.toukei.metro.tokyo.lg.jp/juukiy/2026/jy26000001.htm
- Accessed: October 14, 2026
- Terms of use: Subject to that site's site policy and copyright provisions. Source: Statistics Division, Bureau of General Affairs, Tokyo Metropolitan Government, 「住民基本台帳による東京都の世帯と人口」.
For the nature of the real estate price data (that it is based on a questionnaire survey, that transaction prices are rounded to two significant figures, and that two sources are mixed), see "The nature of the data" in the Overview.
- The external information quoted on this site is provided to illustrate examples of using Kari. This site does not guarantee the accuracy or currency of that information. Quoted sources may be changed or removed without notice.
- The AI output shown on this site was actually obtained in the stated verification environment. However, this site does not guarantee the accuracy or usefulness of that output. AI output varies with the LLM used, its settings, and from one run to the next.
- The correlations on this page are based on a sample of 23 points, and adding or removing a single point changes the conclusion. In fact, excluding Chuo Ward makes them statistically non-significant. They cannot be used as grounds for choosing an area or for investment decisions.
- Correlation does not show causation. Nothing in the figures on this page proves that population growth pushed prices up.
- The price growth rates on this page are not a quality-adjusted price index. They change when the mix of properties traded changes, even if no individual property changes in price.
- Screenshots were taken with the version of Kari current at the time of writing. The display may differ in your version.
- Automated downloads from websites should follow the terms of use and
robots.txtof the target site. - The organizations quoted have no affiliation with, and do not endorse, this site or Kari.