Use Kari's AI agent to analyze the growth in unit-area prices of second-hand condominiums by segment
Copyright © 2026GotoAI Inc.Based on the goose project
The steps on this page were verified in the following environment.
- Kari: version 0.7.3, Windows
- AI provider: OpenAI ChatGPT subscription
- Model: GPT-6.1 Sol High
About this page
On the previous page we looked at "what prices move together with". But knowing the correlations still does not tell you whether to buy. What you want to know in order to make a decision is the trend of change: "properties under which conditions have risen in value the most?"
So we calculate the average annual growth rate G of Y (the unit price per square metre). But a single G for the whole data set has nothing to be compared with and offers no insight for a decision. What is needed is G for each segment at a higher resolution — a small group cut out in the form "municipality name × condition A × condition B × condition C".
This is the part that is quite impossible by hand. There are as many ways of building segments as there are combinations.
- Which variables to use as segment axes (variables full of nulls cannot be used)
- Where to cut numeric variables (at "how many years or less" of building age)
- How to remove segments whose period is too short or whose record count is too small
We give the AI a procedure covering everything from how to choose segment axes and search for cut points to calculating G and the rules for exclusion. The result is a Dataflow with the top 10 segments for each of the 23 wards, 230 rows in all.
The G that comes out of this analysis is the result of searching for the conditions that maximize the growth rate. Many ways of cutting are tried, and the highest value is chosen. So the figure for G cannot be read as it is as a future growth rate. This is covered in "Human-in-the-loop points" at the end of this page.
Preparing the work
-
Check that 「データコレクション1:不動産価格.csv:テーブル1」 (Data Collection 1 : real estate prices CSV : Table 1), created on the earlier pages, is registered in the Data Collection.
-
Open a chat session. On this page the instruction is given in two rounds. The first round creates the segments and the chart; the second has the AI itself read the result.
Instruct the AI
- Give the extraction conditions, the definitions of the variables, how to choose segment axes, the rules for exclusion and the method of calculating G, all in one instruction. It is a long instruction, but if any one part is missing, the meaning of the result changes. The prompts below are English renderings of the Japanese prompts shown in the screenshots; table, column, value and dataflow names are quoted as they appear in the Japanese source data.
Based on the data table 「データコレクション1:不動産価格.csv:テーブル1」, carry out the analysis below. Save the results as dataflows and create charts as instructed.

1. Extract the records where 種類 = "中古マンション等", and use them as the input dataset for the rest of the analysis.
2. Create new variables as follows.
  (1) Create the variable Y = 「平方メートルあたり不動産価格」 (real estate price per square metre) with the formula 「取引価格(総額) ÷ 面積(㎡)」.
  (2) Create the variable 「築年数」 (building age) with the formula 「現在の西暦年 - 建築年」 (current Western calendar year − year built). Convert 「建築年」 to a Western calendar year beforehand if necessary.
3. From the variables other than 市区町村コード, 取引時期, 取引価格(総額), 面積(㎡), 建築年 and 平方メートルあたり不動産価格, select and define candidate variables for segment axes by the following procedure.
  (1) If a variable's null count exceeds 60% of all records, exclude that variable.
  (2) For a categorical variable, use its level values, excluding null, as the segment classes. However, if there is only one class value, exclude that variable.
  (3) For a numeric variable, search for and use the class boundary at which the calculated price growth rate is greatest.
4. Calculate the price growth rate for each segment by the following procedure.
  (1) Include 市区町村名 as a fixed segment class.
  (2) Next, choose any three non-overlapping variables from the other candidate segment-axis variables, and determine the class value of each.
  (2) Extract the data points that meet the segment conditions, and exclude data below the 5th percentile and above the 95th percentile of Y.
  (3) Based on 取引時期, calculate the average annual growth rate G of Y over the whole period as follows.
    (i) Count the records for each 取引時期; where there are fewer than 20, exclude the data for that 取引時期.
    (ii) If fewer than four kinds of 取引時期 remain in the end, exclude that segment.
    (iii) With the year-and-quarter of 取引時期 on the X axis and the mean 平方メートルあたり不動産価格 for the segment in that 取引時期 on the Y axis, calculate the average annual growth rate G, apportioned by linear regression with an intercept.
5. Combine all segments and calculate the average annual growth rate as G0.
6. For each 市区町村名, extract the top 10 segments by G value, and list 市区町村名, the rank within the municipality, the G value, the G0 value, the ratio G/G0, the other segment variables and their class values, the number of records in the segment, the start and end values of the 取引時期 used, the number of 取引時期, and the maximum and minimum record counts per 取引時期; create the dataflow 「中古マンション等単位価格上昇率セグメント」, and create a horizontal bar chart showing the ranking of G.
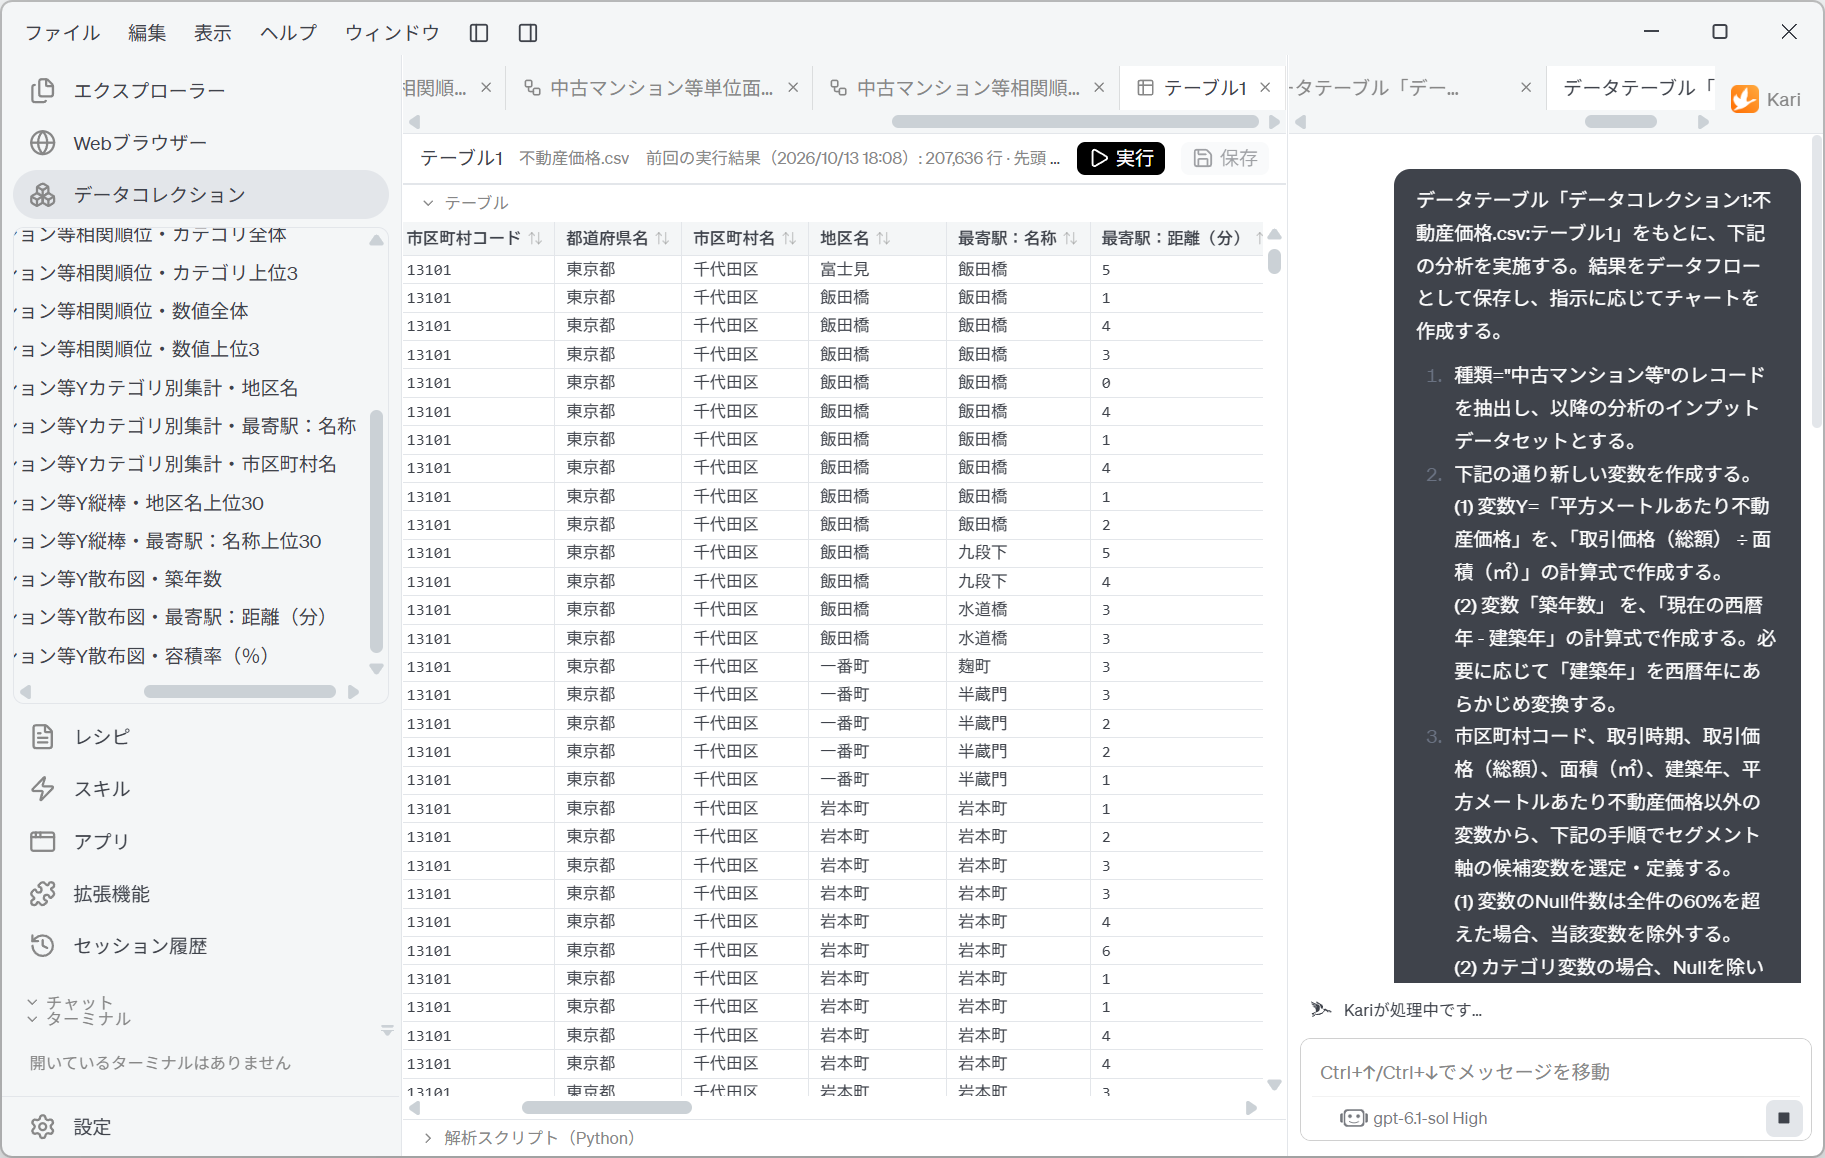
Screenshot shown in the original Japanese.
The way this instruction is put together has a few key points.
| Block of the instruction | What it is for |
|---|---|
| 3-(1) Cut-off at 60% null | Drops unusable axes mechanically. For second-hand condominiums, the land and frontage road columns are almost empty. Without a set threshold, segments get built from variables with only a handful of records. |
| 3-(3) Search for numeric classes | Where to cut building age ("how many years or less") is not something a person can decide. The search is left to the AI. But this becomes the biggest caution, discussed below. |
| 4-(2) Exclude the top and bottom 5% | Keeps extreme unit prices from dominating the slope of the regression. Writing the handling of outliers into the instruction makes the result reproducible. |
| 4-(3)(i) Exclude periods with fewer than 20 records | The mean of a quarter with only a few records is swayed by chance. Set a minimum number of records per period. |
| 4-(3)(ii) Exclude segments with fewer than four periods | Two points always give a straight line. Unless you set a minimum number of points, the slope has no meaning. |
| 5. Calculate G0 | Creates a baseline for comparison. G alone does not tell you whether it is high or low. Only as the ratio G/G0 can it be read. |
| 6. List the output items | Has the AI output all the information needed for verification, down to the record count, the period and the number of periods. A table that lists only G cannot be checked. |
Include "record count", "period" and "number of periods" among the output items. In a table that lists only G values, a line drawn through four quarters and 20 records looks the same as a line drawn through nine quarters and 242 records. Which one you can trust is decided not by G but by the numbers beside it.
Check the AI's work
Screenshot shown in the original Japanese.
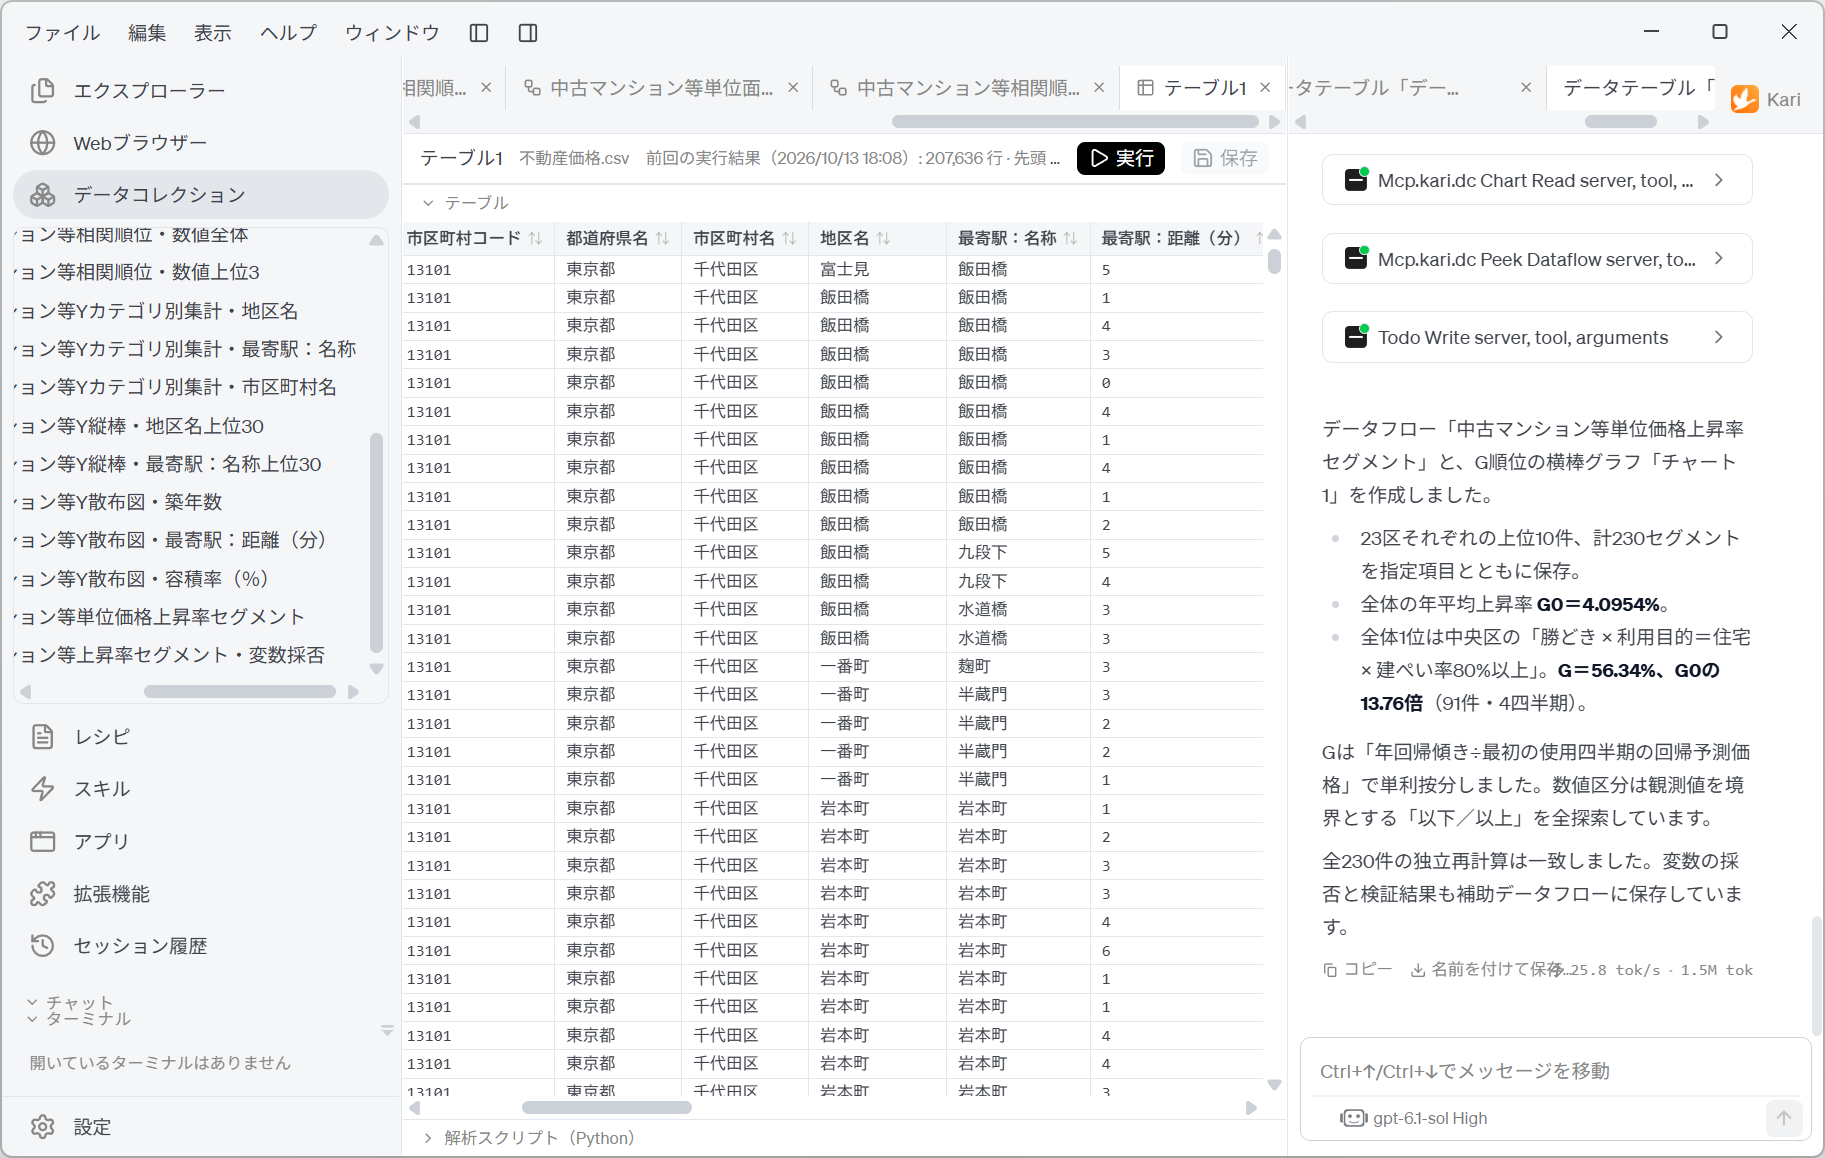
In this example, the AI reports the following.
- The top 10 for each of the 23 wards, 230 segments in all, are saved with the specified items.
- The overall average annual growth rate is G0 = 4.0954%.
- First overall is Chuo Ward's "Kachidoki (勝どき) × intended use = housing × building coverage ratio 80% or more". G = 56.34%, 13.76 times G0 (91 records, four quarters).
- G is apportioned as simple interest: "annual regression slope ÷ regression-predicted price in the first quarter used". For numeric classes, "or less / or more" with observed values as boundaries is searched exhaustively.
- An independent recalculation of all 230 matches. Which variables were adopted or rejected, and the verification results, are also saved in auxiliary Dataflows.
"An independent recalculation of all 230 matched" is a report that the AI calculated its own aggregation again by a different route and checked the two against each other. It confirms that the numbers in the Dataflow are the same as the numbers used when the chart was drawn. It is an assurance that no mix-up occurred in the aggregation.
But this confirms that the calculation is correct, not that the interpretation is correct.
Check the list of segments
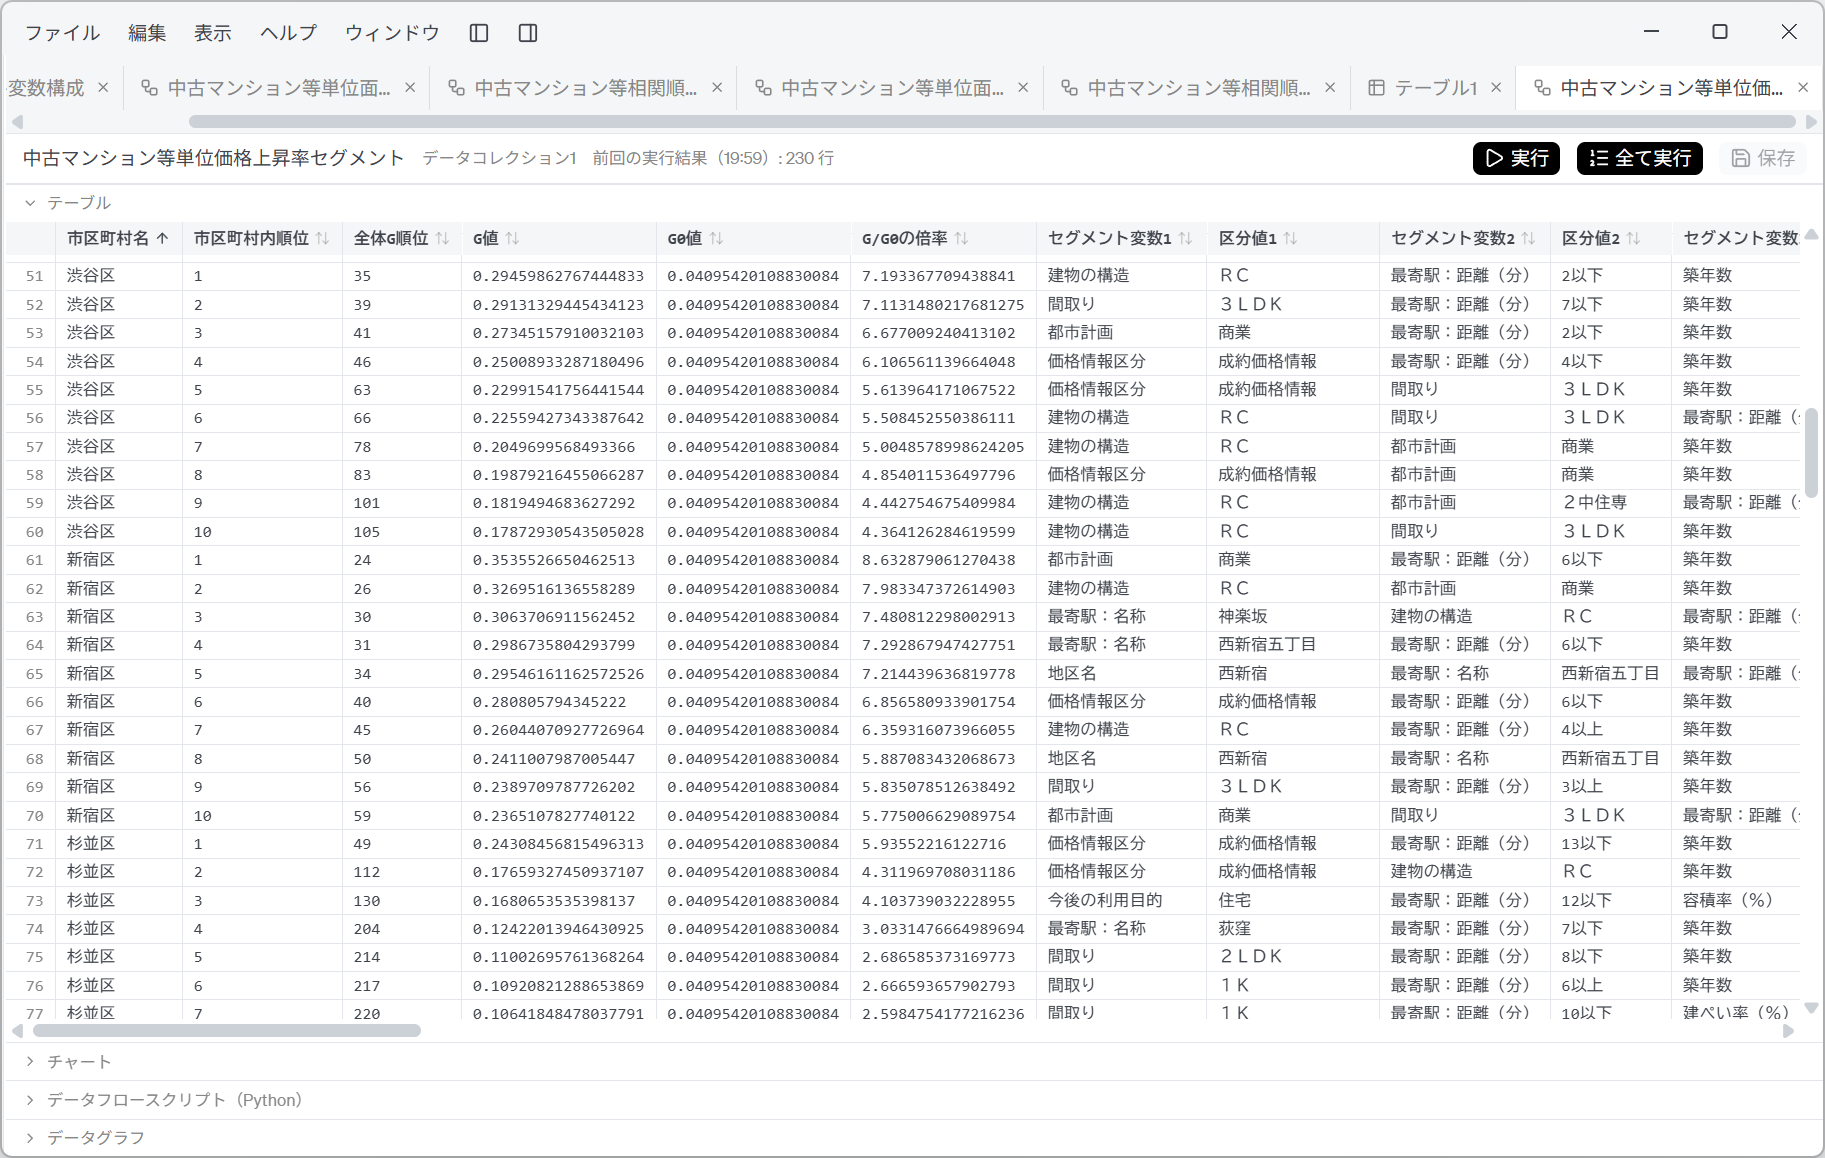
- The Dataflow lists 230 rows. One row is one segment.
Screenshot shown in the original Japanese.
The columns run 「市区町村名/市区町村内順位/全体G順位/G値/G0値/G/G0の倍率/セグメント変数1・区分値1/変数2・区分値2/変数3・区分値3」 (municipality name / rank within municipality / overall G rank / G value / G0 value / G/G0 ratio / segment variable 1 and class value 1 / variable 2 and class value 2 / variable 3 and class value 3), and further to the right come the number of records in the segment, the start and end of the transaction periods, the number of transaction periods, and the maximum and minimum record counts per period.
The items listed in item 6 of the instruction have become columns just as they were. The point of this table is that beside each figure for G sit the record counts and periods that support it.
Look at the ranking of G
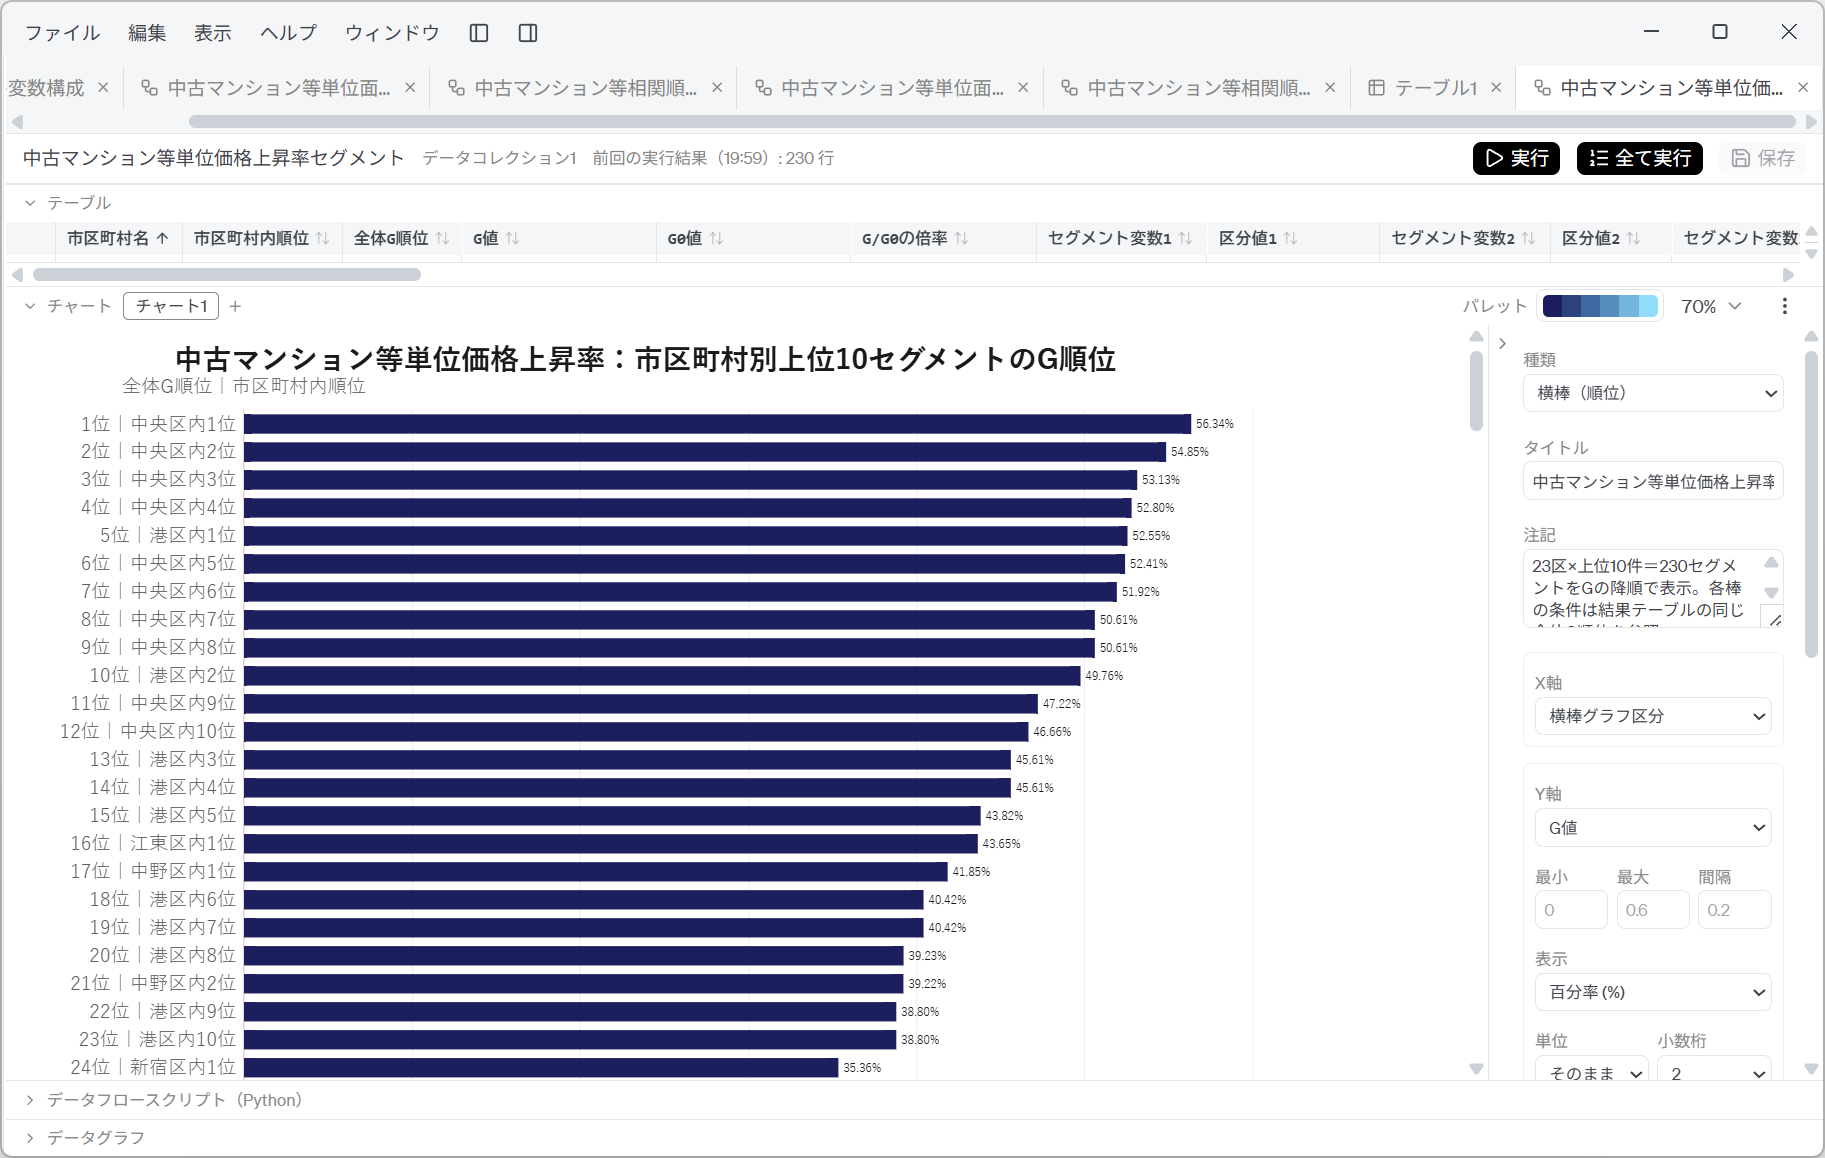
- A horizontal bar chart of the 230 segments in descending order of G.
Screenshot shown in the original Japanese.
The vertical-axis labels have two parts: 「全体G順位|市区町村内順位」 (overall G rank | rank within municipality). Look at ranks 1 to 24, and one feature catches the eye.
| Overall rank | Ward | G |
|---|---|---|
| 1st–4th | Chuo Ward (1st–4th in ward) | 56.34% / 54.85% / 53.13% / 52.80% |
| 5th | Minato Ward (1st in ward) | 52.55% |
| 6th–9th | Chuo Ward (5th–8th in ward) | 52.41% / 51.92% / 50.61% / 50.61% |
| 10th | Minato Ward (2nd in ward) | 49.76% |
| 11th–12th | Chuo Ward (9th–10th in ward) | 47.22% / 46.66% |
| 13th–15th | Minato Ward (3rd–5th in ward) | 45.61% / 45.61% / 43.82% |
Ten of the top 12 are Chuo Ward, and the rest are Minato Ward. Koto Ward comes in at 16th, Nakano Ward at 17th, and only at 24th does Shinjuku Ward appear. Even though the top 10 were collected equally from each of the 23 wards, the structure — the upper end of the ranking skewed towards particular wards — is visible at a glance.
Have the AI discuss the results
This is the main subject of this page. Working through a table of 230 rows is hard for a person, but the AI can read the Dataflow it created and interpret it.
- Specify a ward and ask for an explanation of, and discussion on, the top segments.
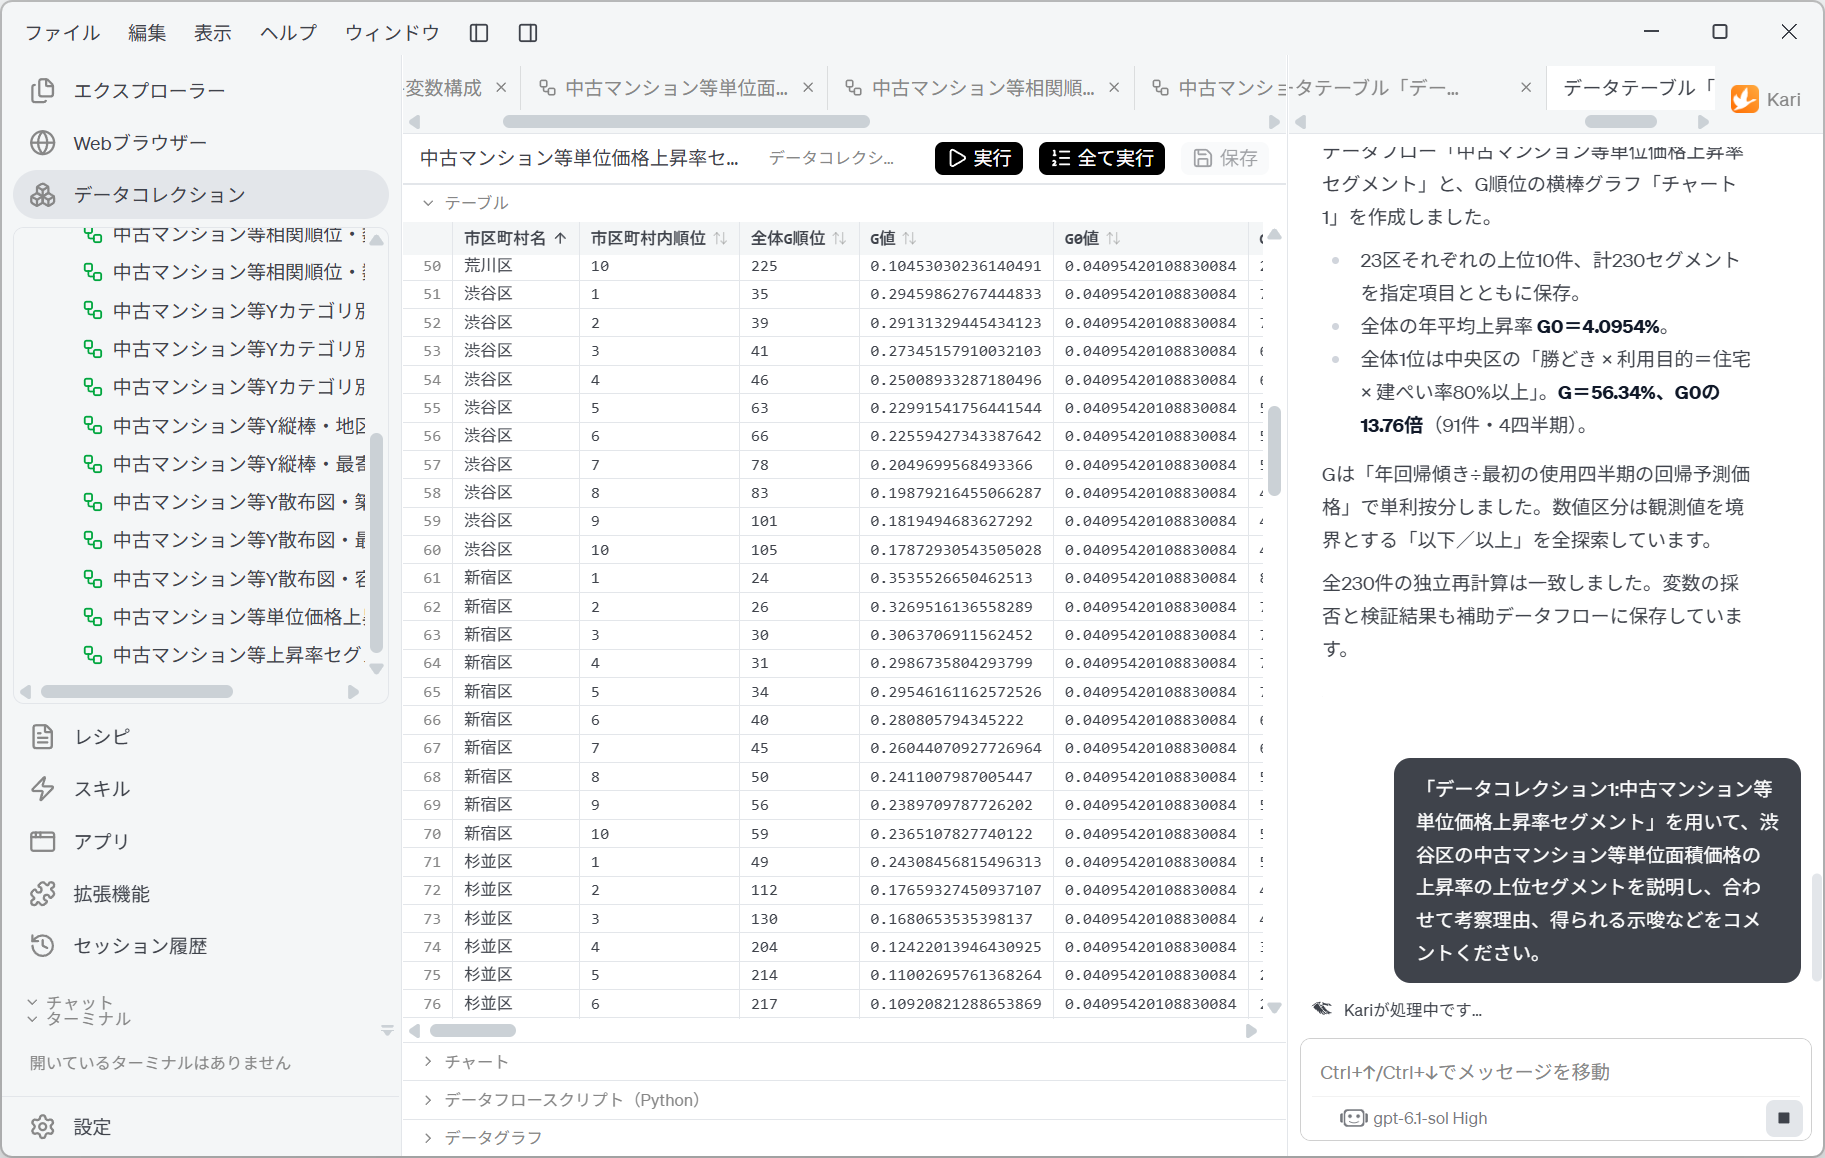
Using 「データコレクション1:中古マンション等単位価格上昇率セグメント」, explain the top segments for growth in the unit-area price of second-hand condominiums in Shibuya Ward (渋谷区), and also comment on the reasons you consider, the insights to be drawn, and so on.
Screenshot shown in the original Japanese.
- For reference, the top 10 segments in Shibuya Ward are as follows.
| Rank in ward | Segment conditions | G | G/G0 | Records | Periods |
|---|---|---|---|---|---|
| 1 | RC (RC) × station 2 min or less × age 27 years or less | 29.46% | 7.19× | 90 | 4 |
| 2 | 3LDK (3LDK) × station 7 min or less × age 56 years or less | 29.13% | 7.11× | 86 | 4 |
| 3 | Commercial (商業) × station 2 min or less × age 54 years or less | 27.35% | 6.68× | 115 | 5 |
| 4 | Closed-sale price information (成約価格情報) × station 4 min or less × age 12 years or less | 25.01% | 6.11× | 87 | 4 |
| 5 | Closed-sale price information × 3LDK × age 44 years or less | 22.99% | 5.61× | 90 | 4 |
| 6 | RC × 3LDK × station 9 min or less | 22.56% | 5.51× | 113 | 5 |
| 7 | RC × Commercial × age 13 years or less | 20.50% | 5.00× | 242 | 9 |
| 8 | Closed-sale price information × Commercial × age 21 years or less | 19.88% | 4.85× | 194 | 8 |
| 9 | RC × Category 2 medium-to-high-rise exclusive residential zone (2中住専) × station 6 min or less | 18.19% | 4.44× | 135 | 6 |
| 10 | RC × 3LDK × age 30 years or less | 17.87% | 4.36× | 108 | 5 |
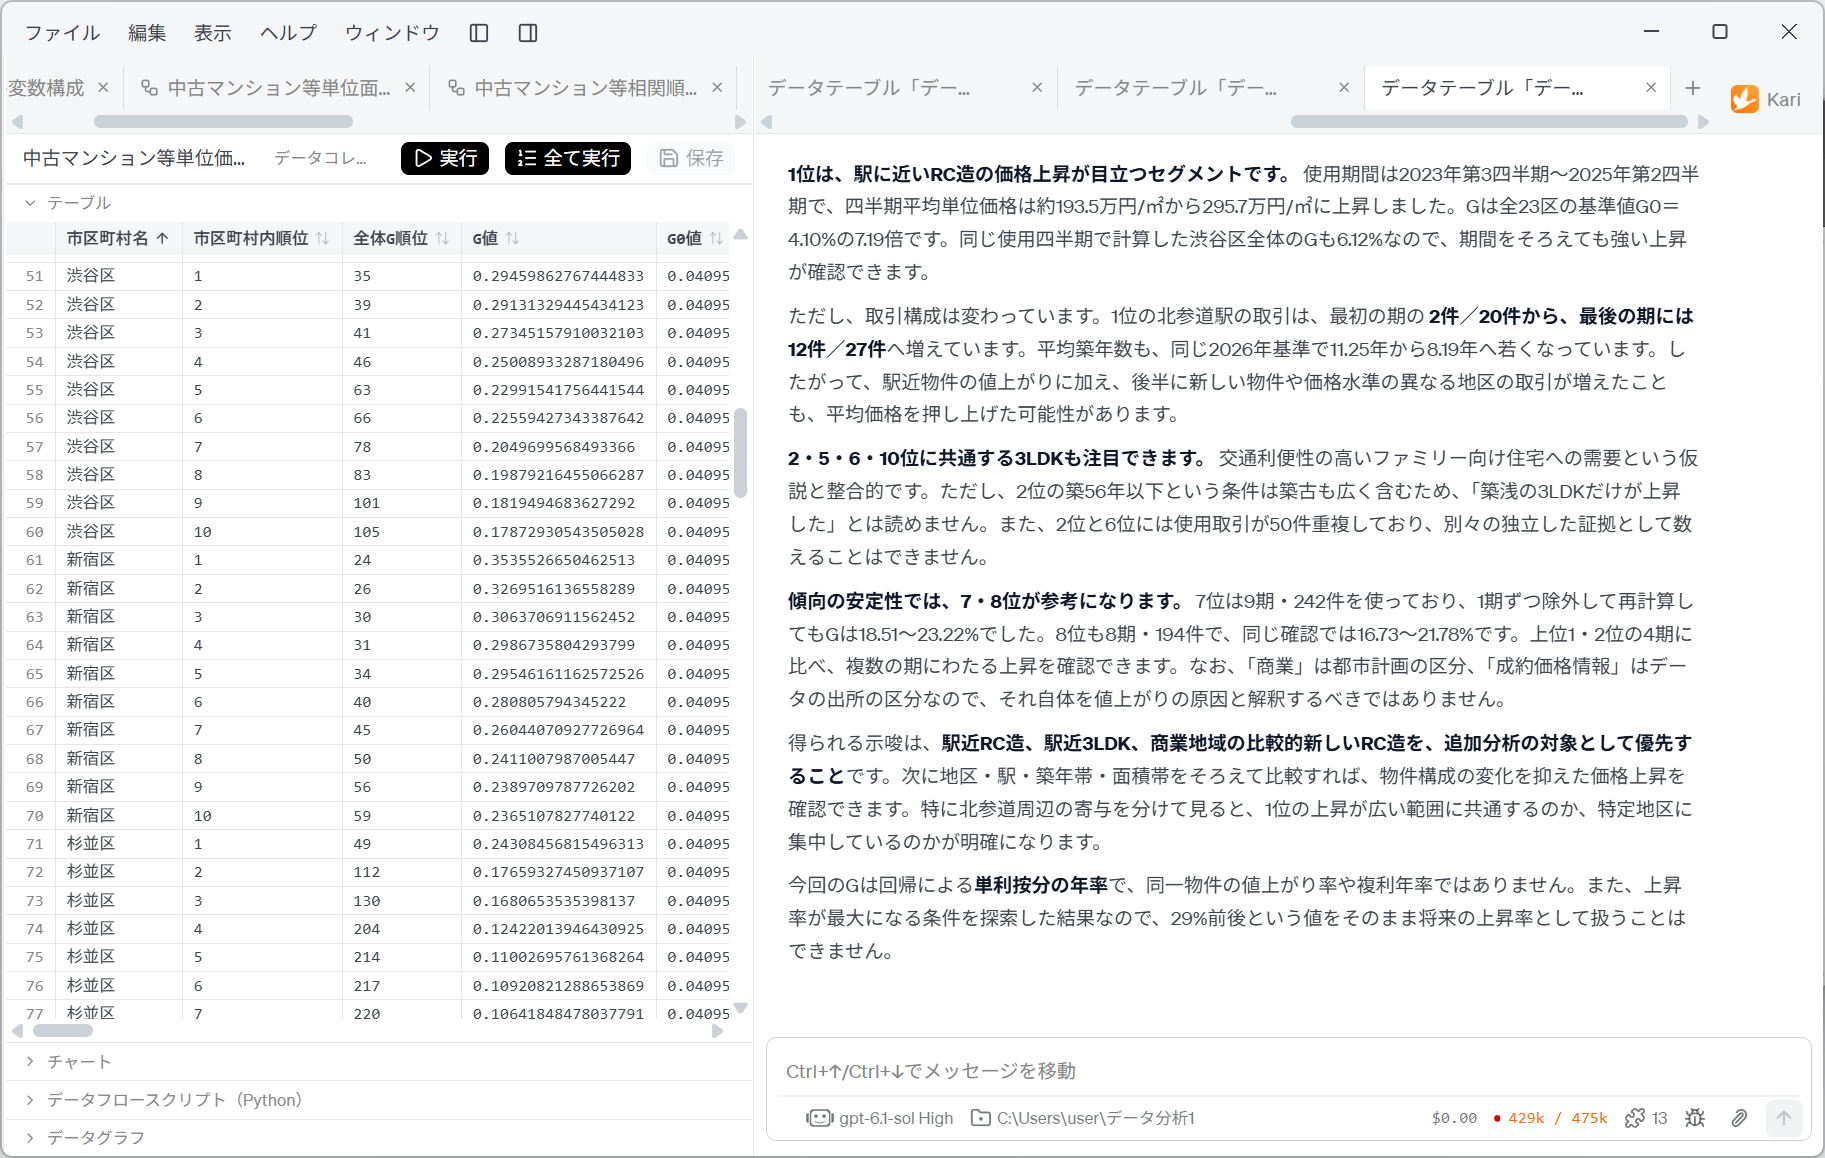
- The AI's answer.
Screenshot shown in the original Japanese.
What deserves attention is that the AI does not simply endorse the ranking as it is. The answer is divided into four parts.
1. It opens up first place and shows what is inside
The period used is Q3 2023 to Q2 2025, and the quarterly average unit price rose from about 1.935 million yen/m² to 2.957 million yen/m². G is 7.19 times the baseline for all 23 wards, G0 = 4.10%. G for Shibuya Ward as a whole, calculated over the same quarters, is also 6.12%, so a strong rise is confirmed even with the period aligned.
G0 is calculated over 20 quarters, but the first-place segment uses only four. If the periods differ, the comparison does not hold. The AI recalculated G for Shibuya Ward as a whole over the same four quarters and confirmed that the difference in period is not the cause.
2. It brings up inconvenient facts on its own
Transactions at Kita-Sando (北参道) station, in first place, increased from 2 of 20 in the first period to 12 of 27 in the last period. The average building age, on the same 2026 basis, also fell from 11.25 years to 8.19 years. So, in addition to price rises for properties near the station, an increase in transactions of newer properties, and of districts at a different price level, in the later half may also have pushed the average price up.
This is the point about changes in composition. It may not be that the same properties rose in value, but simply that more expensive properties joined the mix later. The AI heads off in advance the misreading most likely to happen when looking at the movement of quarterly averages.
3. It questions whether the evidence is independent
Positions 2 and 6 share 50 of the transactions they use, so they cannot be counted as separate, independent pieces of evidence.
Segments are not mutually exclusive. Before celebrating that "3LDK takes four of the top places", you need to check whether those are four separate facts or one fact counted again.
4. It decides what to trust by record count and number of periods
For the stability of the trend, positions 7 and 8 are the useful reference. Position 7 uses 9 periods and 242 records, and recalculating with one period removed at a time gave G between 18.51% and 23.22%. Position 8 also uses 8 periods and 194 records, and the same check gave 16.73% to 21.78%.
G is highest in first place, but the AI says that the ones to trust are positions 7 and 8. The basis is recalculation with one period removed at a time (leave-one-out), a judgement made after confirming that G does not move much.
It also drives home a point about what the classes mean.
「商業」 (commercial) is a city planning class, and 「成約価格情報」 (closed-sale price information) is a class for the source of the data, so neither should itself be interpreted as a cause of price rises.
5. Insights and limits
The insight to be drawn is to give priority, as targets for further analysis, to RC construction near stations, 3LDK units near stations, and relatively new RC construction in commercial zones. Comparing next with district, station, building-age band and floor-area band evened out would confirm price growth with changes in the mix of properties held down.
G here is an annual rate apportioned as simple interest by regression; it is not the rate of increase of the same property, nor a compound annual rate. Also, since it is the result of searching for the conditions that maximize the growth rate, a value of around 29% cannot be treated as it is as a future growth rate.
The conclusion is not "this is what makes money in Shibuya Ward" but "what to investigate next". That is the right exit for a segment analysis.
The AI can reread the Dataflow it created. Record counts, numbers of periods and the list of quarters used are all saved as columns, so a cross-check such as "positions 2 and 6 share 50 transactions" can be carried out without a person's hand.
Put the other way round, if the output items had not included record counts and periods, this discussion would not be possible. Listing the verification items in item 6 of the instruction is what pays off here.
Human-in-the-loop points
Do not leave everything to the AI. Check the following yourself.
-
Do not forget that G is "a value chosen to be the maximum"
This is the most important point on this page. The numeric classes are decided by "searching exhaustively over 'or less' and 'or more' with observed values as thresholds, and adopting the conditions that maximize G". On top of that, the top 10 are then chosen from among them. It is a table of the best results out of many attempts, so G always contains an upward bias. The AI itself states plainly that "a value of around 29% cannot be treated as it is as a future growth rate". -
Read G after looking at the number of periods and records
In Shibuya Ward, positions 1, 2, 4 and 5 use only four periods. That means an average annual growth rate drawn from one year's worth of data. Positions 7 (9 periods, 242 records) and 8 (8 periods, 194 records) have lower values but are more solid as a trend. Do not read from the top of the ranking; read from the rows with the most periods. -
Suspect changes in composition
When the average unit price within a segment rises, it does not necessarily mean that the same properties rose in value. In first place, the share of transactions at Kita-Sando station rose from 2/20 to 12/27, and the average building age fell from 11.25 years to 8.19 years. Always consider the possibility that only the contents were swapped. -
Check for overlap between segments
Positions 2 and 6 shared 50 of the transactions they used. When similar conditions line up near the top, they may simply be the same group of transactions counted again from a different angle. Do not mistake them for several independent pieces of evidence. -
Do not mistake what a class means
「成約価格情報」 is the source of the data, not a property of the real estate. Even if it appears in the conditions of a top segment, it does not mean "buy properties with closed-sale price information and they will rise". As explained in "The nature of the data" on the overview page, the two sources are collected in different ways. -
Check the definition of G
G is "annual regression slope ÷ regression-predicted price in the first quarter used", apportioned as simple interest. It is neither a compound annual rate nor the rate of increase of the same property. When setting it beside growth rates from other material, always check that the definitions are the same. -
Do not use it directly for investment decisions
G on this page is a descriptive indicator obtained by searching for conditions in past transaction data. It does not predict future prices. For purchase or investment decisions, always consider the original data together with other sources of information.
How segment axes are chosen, the range of the search for cut points and the depth of the discussion vary with the LLM used. In particular, the method of searching for numeric classes strongly affects the result, so check what was actually done in the Dataflow's 「数値区分探索方法」 (numeric class search method) column.
References
The data analyzed on this page was obtained from the Real Estate Information Library (「不動産情報ライブラリ」) of the Ministry of Land, Infrastructure, Transport and Tourism. Screenshots are reproduced as quotations with the source stated. The segments, growth rates and discussion that the AI produced were generated by GotoAI as an example of Kari's operation; they were not created or published by the Ministry of Land, Infrastructure, Transport and Tourism.
- Material: Real Estate Information Library (「不動産情報ライブラリ」), 「不動産価格(取引価格・成約価格)情報の検索・ダウンロード」 (search and download of real estate price information: transaction prices and closed-sale prices)
- Provider: Ministry of Land, Infrastructure, Transport and Tourism (MLIT)
- URL: https://www.reinfolib.mlit.go.jp/realEstatePrices/
- Accessed: October 13, 2026
- Terms of use: Subject to that site's terms of use. Source: MLIT website (URL above).
For the nature of the data (that it is based on a questionnaire survey, that transaction prices are rounded to two significant figures, and that two sources are mixed), see "The nature of the data" in the Overview.
- The external information quoted on this site is provided to illustrate examples of using Kari. This site does not guarantee the accuracy or currency of that information. Quoted sources may be changed or removed without notice.
- The AI output shown on this site was actually obtained in the stated verification environment. However, this site does not guarantee the accuracy or usefulness of that output. AI output varies with the LLM used, its settings, and from one run to the next.
- The average annual growth rate G on this page is a value obtained by searching for the conditions that maximize the growth rate. It does not predict future price movements and cannot be used as grounds for investment decisions.
- Transaction prices are rounded to two significant figures, and locations are given only down to the level of town (町) or district (大字). The average unit prices of the segments are subject to the limits of this granularity.
- Screenshots were taken with the version of Kari current at the time of writing. The display may differ in your version.
- This page deals with data on actual real estate transaction prices. If you use it for purchase or investment decisions, always check it against the original data and make your own judgement, at your own responsibility.
- The organizations quoted have no affiliation with, and do not endorse, this site or Kari.