Have the AI automate joining data and building a fact table
Copyright © 2026GotoAI Inc.Based on the goose project
The steps on this page were verified in the following environment.
- Kari: version 0.7.3 Windows
- AI provider: Anthropic Claude Subscription
- Model: Claude Opus 5.5 High
About this page
In data analysis, you usually join different data files for a single analytical purpose, creating one block of data. For example, to estimate "total inbound spending by nationality and region", we need to join the data obtained on the previous page: the Consumption Trend Survey for Foreigners Visiting Japan (「インバウンド消費動向調査」) data, the visitor arrivals data and the cruise landing permits (「船舶観光上陸許可」) data. The reason is that the information needed for the calculation is split across different data sets.
What matters here is the concept of "data integrity". The number of foreign tourists who visited Japan in the past and the amount they spent are, in reality, information that exists together. But because of constraints such as survey methods and the availability of data, or for reasons such as convenience in keeping the data, information that is really one whole is collected and stored in fragments as separate data sets, as it is now. Being able to correctly restore the original block of information from several fragments of data is what we call "the data has integrity".
When joining, you define the keys and the attributes of the data. In other words, you decide what to join on and what to make the main subject of the processing. Often, to prepare for all the processing that follows, you first build one comprehensive joined table. Such a joined table is sometimes called a "fact table".
In this example, we take 「国籍・地域」 (nationality and region) and 「年月」 (year and month) as the keys and the other data columns as attributes, and leave it to the AI to build one fact table.
The travel spending per person published by the Japan Tourism Agency is for "general visitors (non-cruise)", excluding cruise passengers. JNTO's visitor arrivals, on the other hand, include cruise passengers. Multiplying the two as they are would apply the general visitors' spending per person to the cruise passengers too.
一般客数 = 訪日外客数 − クルーズ客数
(General visitors = visitor arrivals − cruise passengers.) The cruise landing permits data is joined to fill in the right-hand side of this subtraction. For details, see the overview.
Instruct the AI
- Taking as input the 65 Tables created on the previous page (consumption trend survey 10 + visitor arrivals statistics 24 + cruise landing permits 31), give the keys, granularity, attributes and handling of missing data in one prompt.
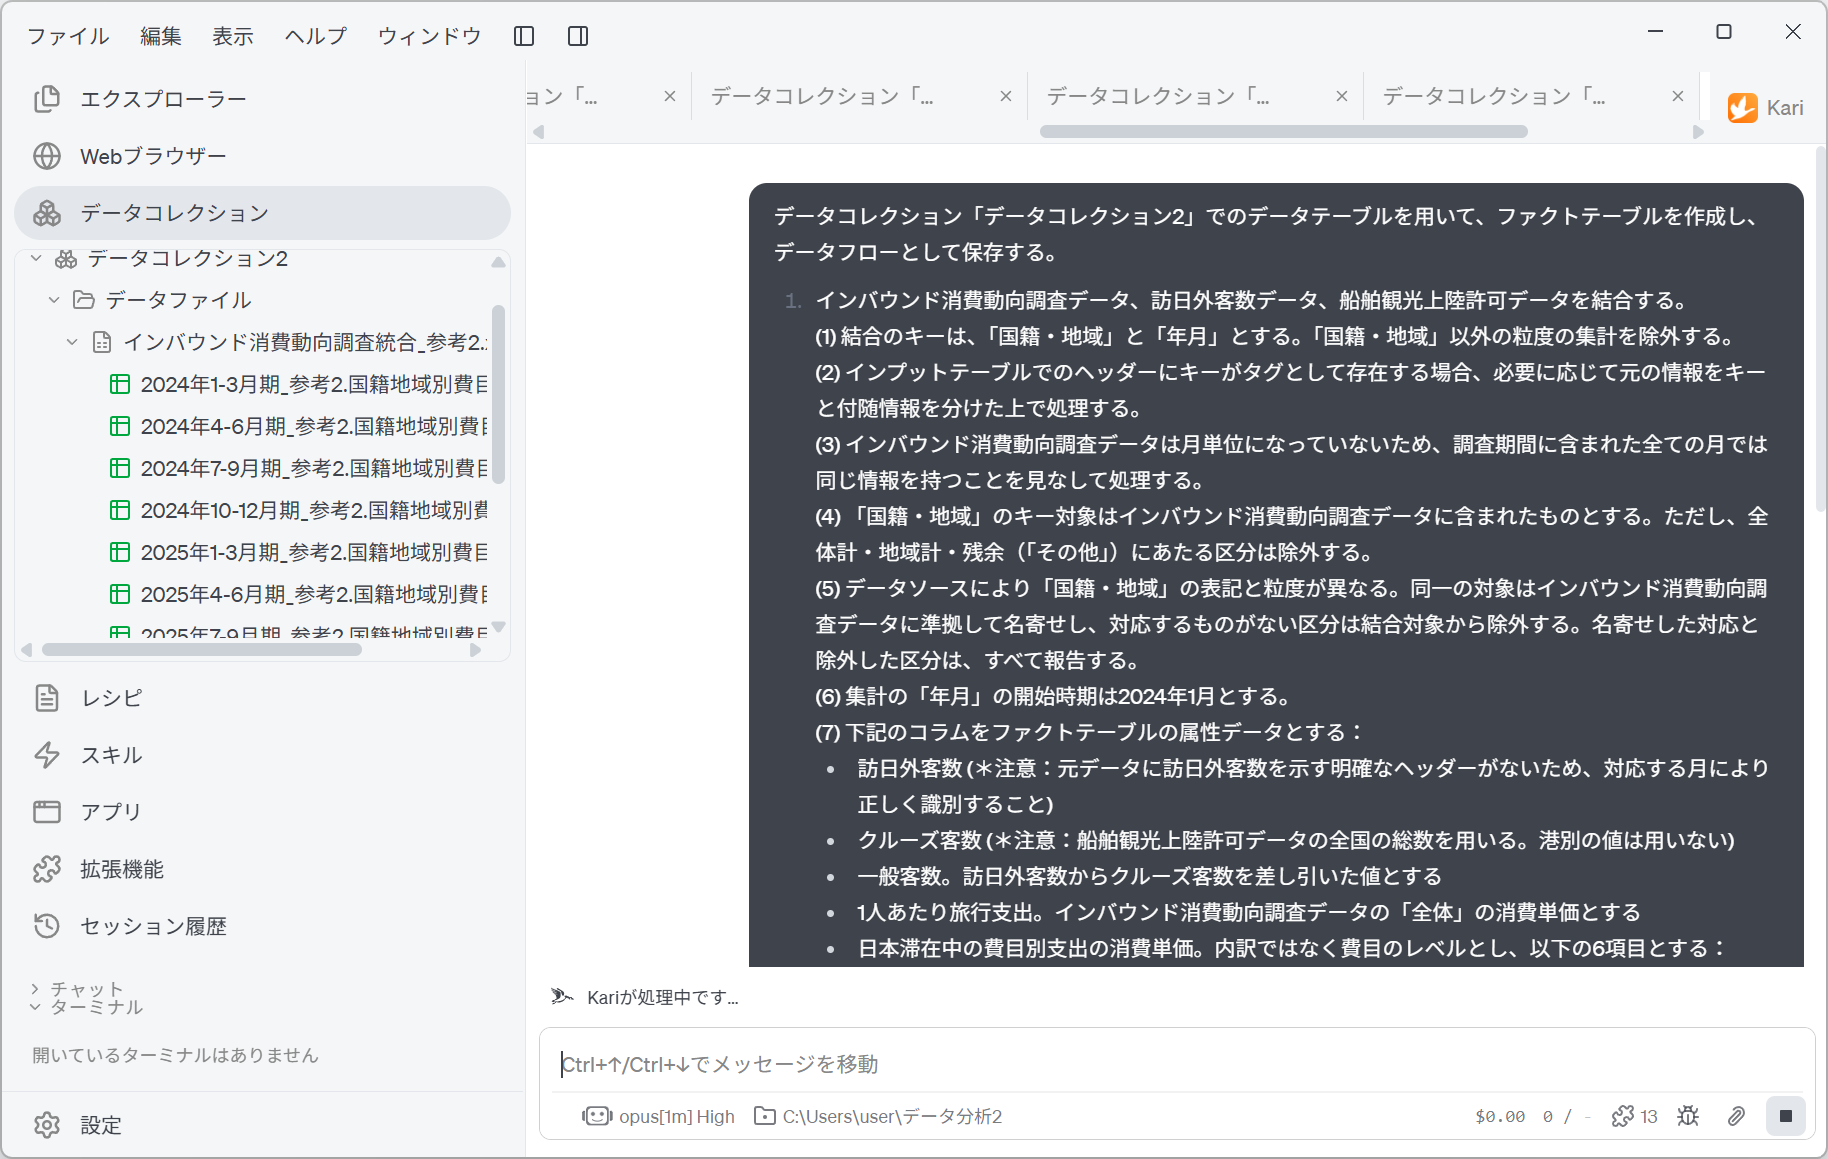
The prompt below is an English rendering of the Japanese prompt shown in the screenshot; Data Collection, Dataflow, column and value labels are quoted as they appear in Kari and in the Japanese source data.
Using the data Tables in the Data Collection 「データコレクション2」, build a fact table and save it as a Dataflow.

1. Join the consumption trend survey data, the visitor arrivals data and the cruise landing permits data.
  (1) The join keys are 「国籍・地域」 (nationality and region) and 「年月」 (year and month). Exclude aggregates at any granularity other than 「国籍・地域」.
  (2) Where a key is present as a tag in the headers of an input Table, process the original information, as needed, after separating it into the key and the accompanying information.
  (3) The consumption trend survey data is not by month, so treat every month included in the survey period as having the same information.
  (4) The 「国籍・地域」 keys are those included in the consumption trend survey data. However, exclude the categories that are an overall total, a regional total or a remainder (「その他」, other).
  (5) The labelling and granularity of 「国籍・地域」 differ between data sources. Match identical entities to the consumption trend survey data's labelling, and exclude from the join any category that has no counterpart. Report every mapping made and every category excluded.
  (6) The 「年月」 of the aggregation starts in January 2024.
  (7) Use the following columns as the attribute data of the fact table:
    - 訪日外客数 (visitor arrivals) (*Note: the source data has no clear header indicating visitor arrivals, so identify it correctly by the corresponding month)
    - クルーズ客数 (cruise passengers) (*Note: use the national total of the cruise landing permits data. Do not use the values by port)
    - 一般客数 (general visitors). This is visitor arrivals minus cruise passengers
    - 1人あたり旅行支出 (travel spending per person). This is the spending per person for 「全体」 (overall) in the consumption trend survey data
    - Spending per person by item during the stay in Japan. Use the spending item level, not the breakdown, with the following six items:
      - 宿泊費 (accommodation)
      - 飲食費 (food and drink)
      - 交通費 (transport)
      - 娯楽等サービス費 (entertainment and services)
      - 買物代 (shopping)
      - その他 (other)
  (8) If a nationality or region does not appear in the cruise landing permits data for a month, it means there were 0 landing permits that month. Set cruise passengers to 0 and calculate general visitors. However, for months where the cruise landing permits data itself does not exist, set both cruise passengers and general visitors to Null.
  (9) Where data is otherwise missing, put Null values in the joined table.

 2. Save the joined table as the Dataflow 「インバウンドファクトデータ」 (inbound fact data).
Screenshot shown in the original Japanese.
The way this prompt is put together has the following points.
| Block of the prompt | Purpose |
|---|---|
| 1-(1) Keys and granularity | Fixes the join keys first and has the AI exclude granularities other than 「国籍・地域」. All three data sets contain total rows (全国籍・地域, 総数, アジア計… : all nationalities and regions, total, Asia total…), so without this, they would be joined with totals and individual entries still in the same column. |
| 1-(2) Separating tags in headers | In the consumption trend survey, keys are embedded in the headers, as in 韓国_消費単価 (Korea_spending per person). We give only the policy: split the column names into keys and measures. |
| 1-(3) Handling quarters | The spending side is quarterly; the visitor side is monthly. Unless you set a rule for joining data of different granularities, the AI may apportion values its own way, or keep only the quarterly rows. |
| 1-(4) Basis for the key entities | Decides which data set to align with. By taking the consumption trend survey side as the basis, countries not covered by the survey don't get mixed in. |
| 1-(5) Matching names and reporting | We don't give a concrete mapping table. We decide only the target to match to (the consumption trend survey's labels) and have the AI report what it matched and how. This keeps our own assumptions out, and a person does the checking. |
| 1-(7) Notes on attributes | The visitor arrivals statistics have no column named 「訪日外客数」 (visitor arrivals), and the cruise landing permits data has national and per-port values side by side. The notes say which to take. |
| 1-(8) Distinguishing 0 from Null | The easiest place to go wrong. See the caution below. |
| 1-(9) Handling missing data | Specifies that combinations that could not be joined are filled with Null. Whether rows are dropped or Null is inserted changes the aggregation that follows. |
The cruise landing permits data only lists, as rows, the nationalities that had landing permits that month. A country missing from a month does not mean "there is no data"; it means "there were 0".
If you leave this as Null, you get 一般客数 = 訪日外客数 − Null (general visitors = visitor arrivals − Null), and general visitors become Null as well. A number of visitors you actually know disappears.
On the other hand, a month for which the statistics themselves have not been published (August 2026 in this example) is genuinely unknown, not 0. Filling it with 0 makes visitor arrivals become general visitors as they are, and treats it as if there were no cruise passengers.
The same "blank" has two meanings, so prompt item 1-(8) distinguishes them explicitly.
Include the exclusion of granularities in the prompt. The consumption trend survey has total rows such as 「全国籍・地域」 (all nationalities and regions), 「中東」 (Middle East), 「北欧」 (Nordic countries) and 「その他」 (other); the visitor arrivals statistics have 「総数」 (total), 「アジア計」 (Asia total) and 「ヨーロッパ計」 (Europe total); and the cruise landing permits data has 「総数」, 「アジア」 (Asia) and 「ヨーロッパ」 (Europe). Unless these are excluded from the keys, individual countries and totals sit in the same column, and summing them counts twice.
Check the AI's work
I have saved the Dataflow 「インバウンドファクトデータ」. 672 rows = 21 nationalities and regions × 32 months (2024-01 to 2026-08), zero duplicate keys.
The row count is broken down as 21 × 32 = 672, and the report also states that there are zero duplicate keys. The most common failure in a join is "keys are duplicated and the rows multiply", so it matters that this has been checked.
The columns are as follows.
| Column | Content |
|---|---|
| 国籍・地域 | Join key (nationality and region) |
| 年月 | YYYY-MM (join key; year and month) |
| 訪日外客数 | JNTO's visitor arrivals (including cruise passengers) |
| クルーズ客数 | National total of cruise landing permits |
| 一般客数 | Visitor arrivals − cruise passengers (general visitors) |
| 1人あたり旅行支出 | Spending per person for 「全体」 (overall) in the consumption trend survey (travel spending per person) |
| 宿泊費_消費単価 and the other five items | Spending per person by spending item (six columns) |
The three visitor-count columns sit next to each other, with the per-person spending columns to their right. Because the ingredients of the subtraction (visitor arrivals, cruise passengers) sit next to its result (general visitors), you can follow the check by eye.
Key points of the processing
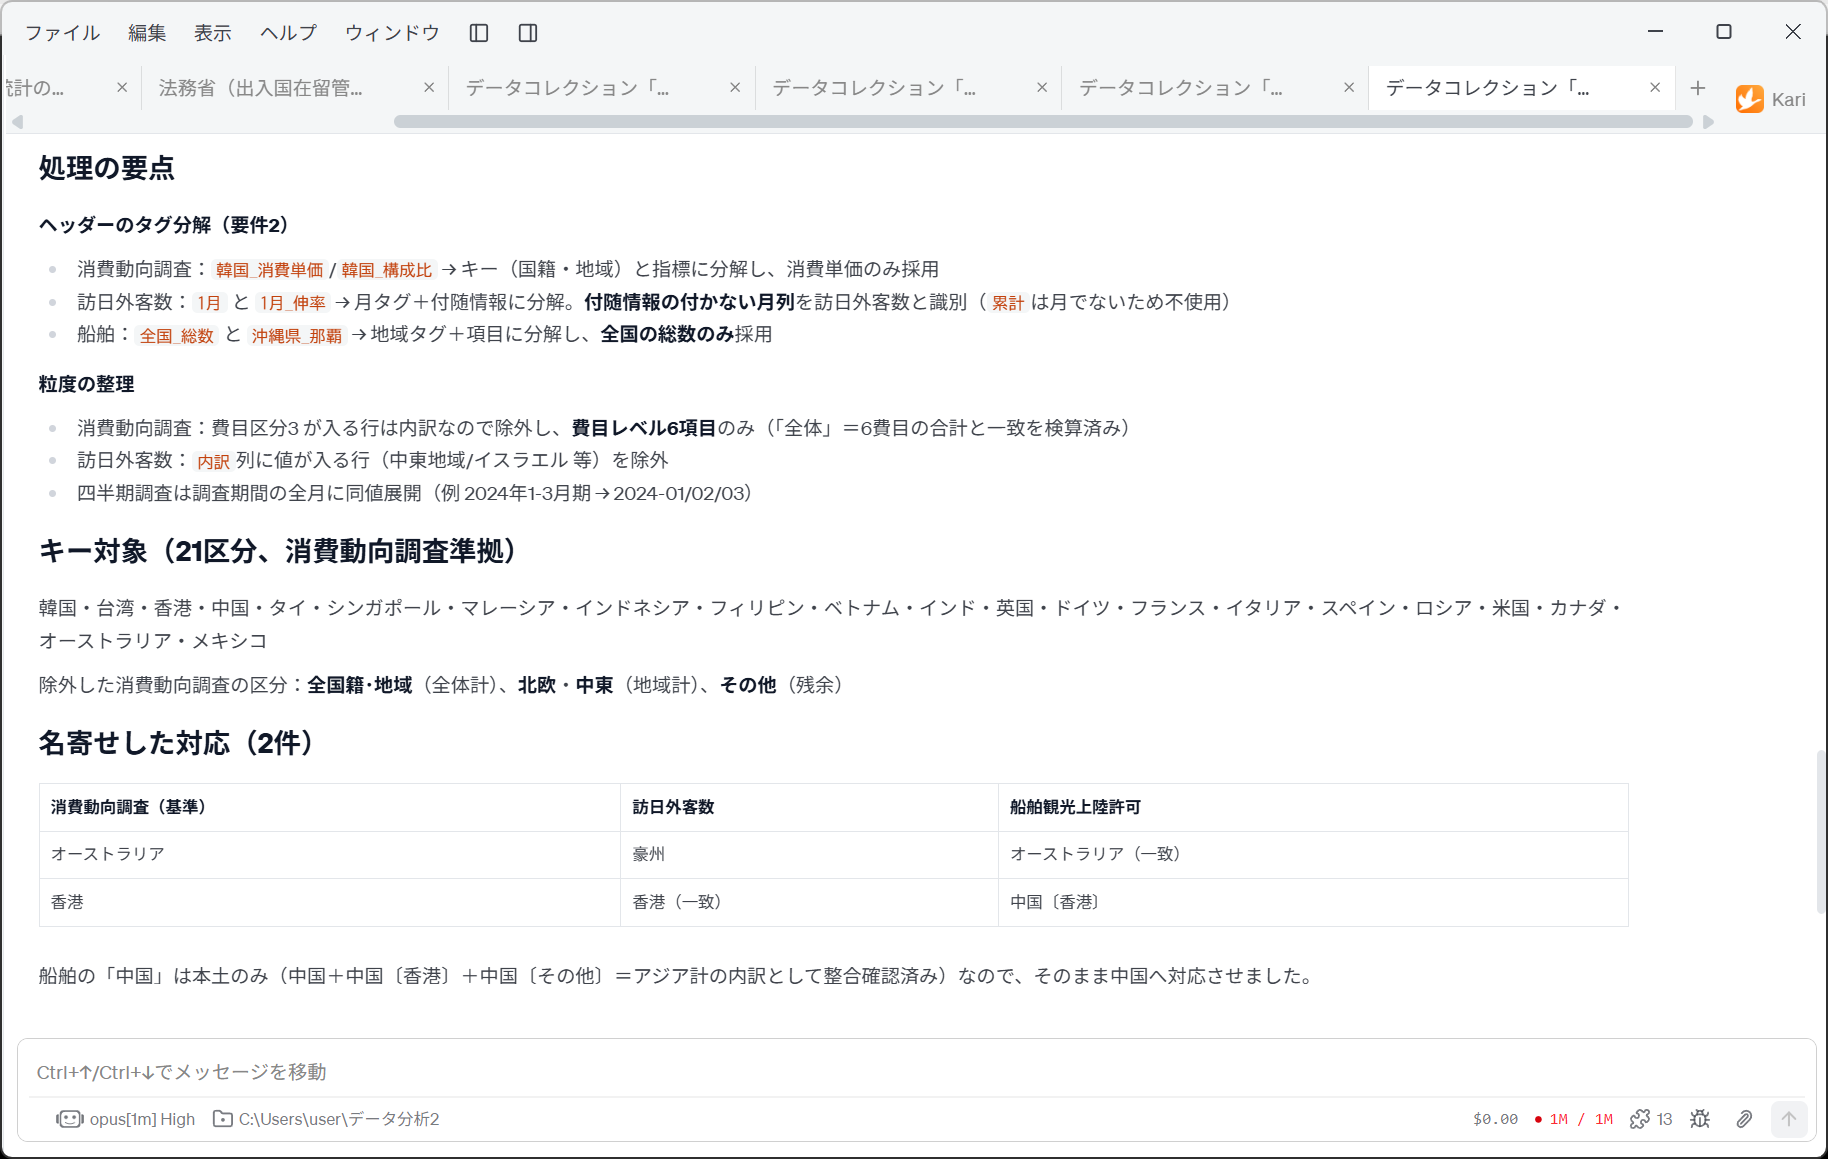
The AI explains what it decided, and how, for five parts of the processing.
Screenshot shown in the original Japanese.
1. Splitting tags in the headers
All three data sets share the same problem: keys are embedded in the headers. The answer to prompt item 1-(2) is summed up in three lines.
- Consumption trend survey:
韓国_消費単価/韓国_構成比→ split into key (nationality and region) and measure, using spending per person only- Visitor arrivals:
1月and1月_伸率(January, January_growth rate) → split into month tag + accompanying information. Identified the month columns without accompanying information as visitor arrivals (累計, cumulative total, is not a month and is not used)- Cruise:
全国_総数and沖縄県_那覇→ split into area tag + item, using only the national total
The same operation, "split the column names", extracts something different from each data set. In the consumption trend survey it discards 構成比 (share); in visitor arrivals it discards _伸率 (growth rate) and 累計; in the cruise data it discards the 県_港 (prefecture_port) columns. What is discarded is different in all three, yet the prompt has only the one sentence "process … after separating it into the key and the accompanying information".
Excluding 累計 makes a real difference. Had it been picked up as a visitor count, the annual total would have slipped in as a monthly value.
2. Sorting out granularity
- Consumption trend survey: rows with 費目区分3 filled in are breakdowns, so they are excluded, keeping only the six spending-item-level items (checked that 「全体」 = the sum of the six items)
- Visitor arrivals: excluded rows with a value in the
内訳(breakdown) column (中東地域/イスラエル etc.: Middle East/Israel)- The quarterly survey is spread with the same value over every month of the survey period (e.g. 2024年1-3月期, January-March 2024 → 2024-01/02/03)
What is in parentheses matters. The AI drops the breakdown rows after confirming that the 「全体」 spending per person matches the sum of the six items. Drop too many breakdown rows and the total won't match; drop too few and it won't match either. The fact that the check holds is itself evidence that the granularity was cut correctly.
The third point, "spreading the same value", is the most important property to keep in mind when reading this fact table. We look at the actual values in the next section.
3. Fixing the key entities
Key entities (21 categories, following the consumption trend survey)
韓国・台湾・香港・中国・タイ・シンガポール・マレーシア・インドネシア・フィリピン・ベトナム・インド・英国・ドイツ・フランス・イタリア・スペイン・ロシア・米国・カナダ・オーストラリア・メキシコ (Korea, Taiwan, Hong Kong, China, Thailand, Singapore, Malaysia, Indonesia, Philippines, Vietnam, India, UK, Germany, France, Italy, Spain, Russia, USA, Canada, Australia, Mexico)
The 21 categories are listed by name. The number "21 nationalities and regions" alone doesn't tell you which countries are in and which dropped out. Because they are given as a list, you can check them by eye. The rows of the fact table also follow this order.
4. Name matching and excluding granularities
Screenshot shown in the original Japanese.
Consumption trend survey categories excluded: 全国籍・地域 (overall total), 北欧・中東 (Nordic countries, Middle East; regional totals), その他 (other; remainder)
Mappings made (2)
Consumption trend survey (basis) Visitor arrivals Cruise landing permits オーストラリア 豪州 オーストラリア (match) 香港 香港 (match) 中国〔香港〕
Note that there are only two name mappings. Across statistics produced separately by three government bodies, only two labels differed. The AI also gives reasons for what it did not map.
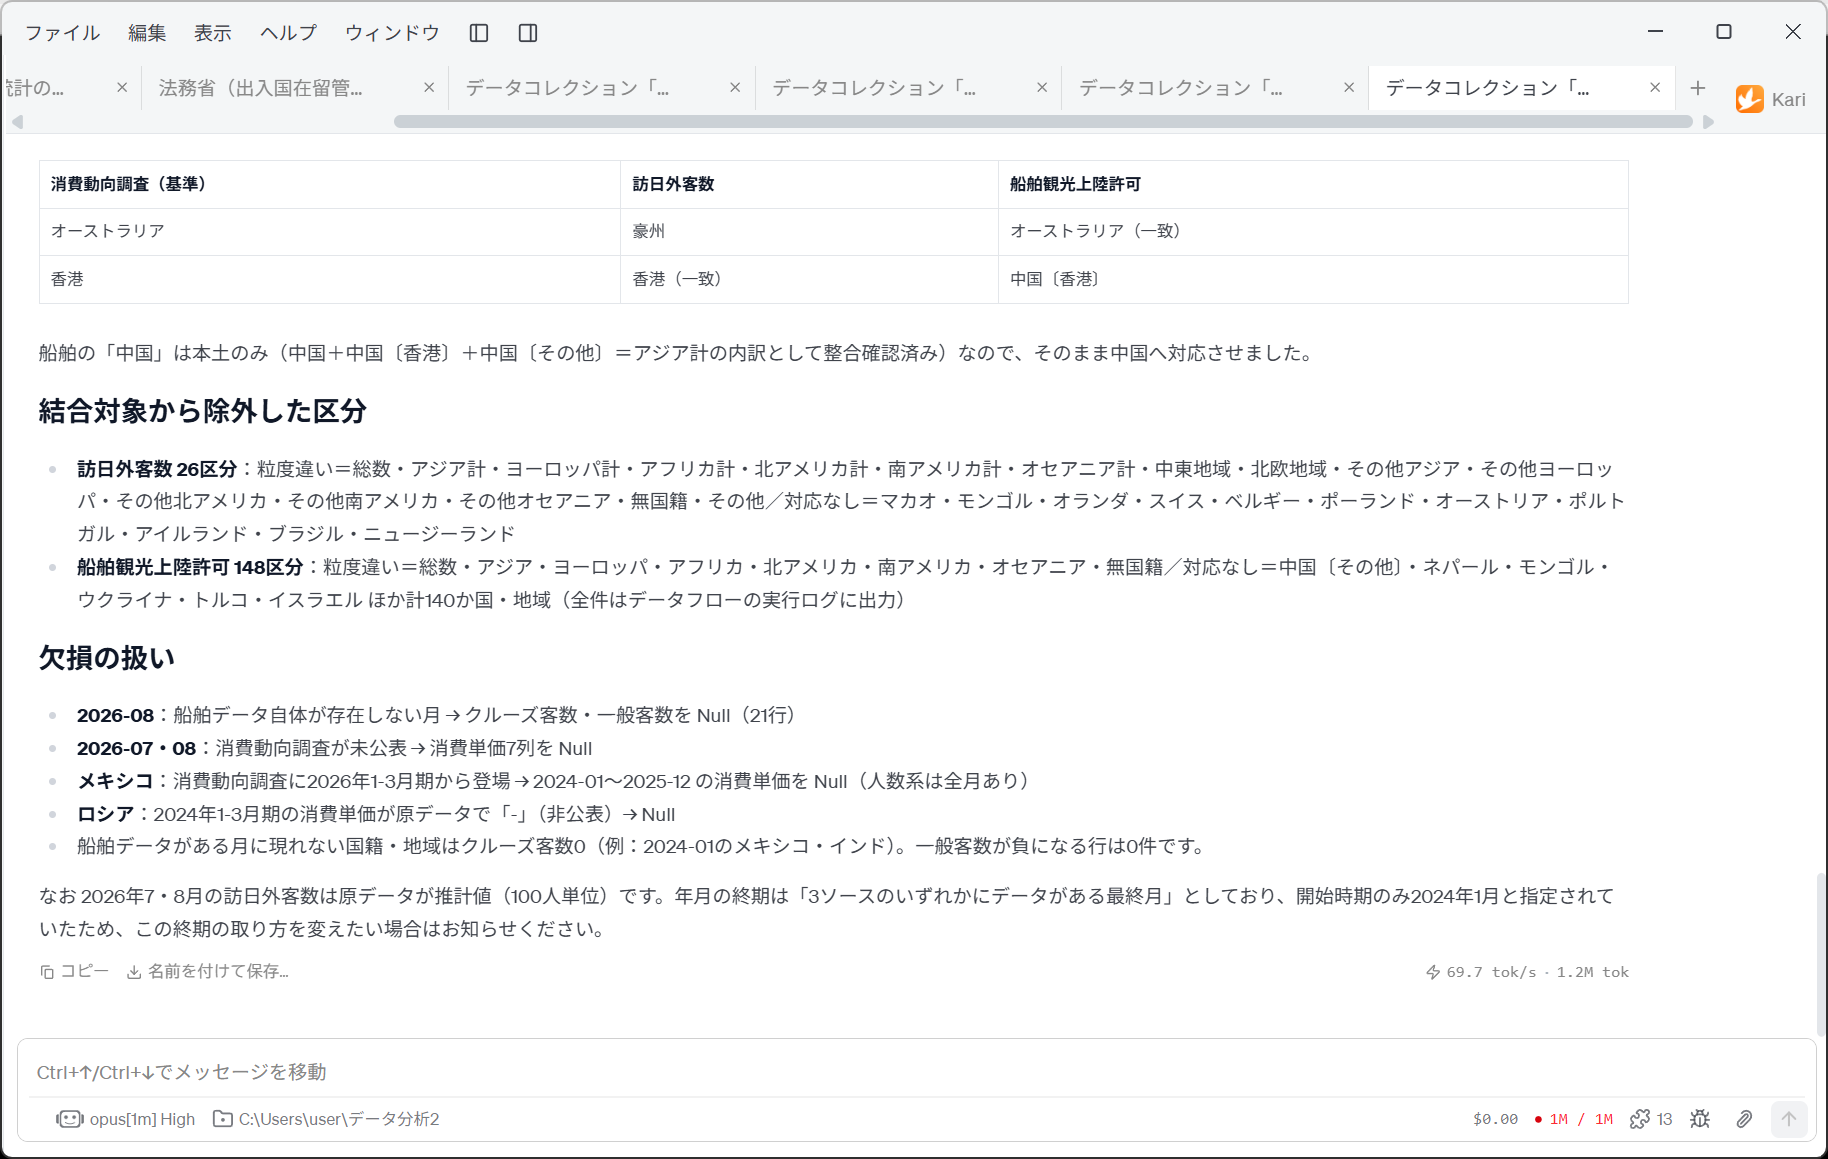
In the cruise data, 「中国」 is the mainland only (consistency checked: 中国 + 中国〔香港〕 + 中国〔その他〕 = a breakdown of the Asia total), so I mapped it directly to 中国 (China).
It decides whether 中国 can be used as it is after checking it by addition. Adding 中国〔その他〕 (China [other]) to 中国 would have inflated the figure for mainland China.
The excluded categories are reported with their counts too.
- Visitor arrivals, 26 categories: different granularity = 総数・アジア計・ヨーロッパ計…・中東地域・北欧地域・その他アジア… (total, Asia total, Europe total…, Middle East, Nordic region, other Asia…) / no counterpart = マカオ・モンゴル・オランダ・スイス・ベルギー・ポーランド・オーストリア・ポルトガル・アイルランド・ブラジル・ニュージーランド (Macao, Mongolia, Netherlands, Switzerland, Belgium, Poland, Austria, Portugal, Ireland, Brazil, New Zealand)
- Cruise landing permits, 148 categories: different granularity = 総数・アジア・ヨーロッパ… (total, Asia, Europe…) / no counterpart = 中国〔その他〕・ネパール・モンゴル・ウクライナ・トルコ・イスラエル (China [other], Nepal, Mongolia, Ukraine, Turkey, Israel) and others, 140 countries and regions in all (the full list is written to the Dataflow's run log)
Four kinds of work are being done here at once.
- Excluding granularity column-wise — dropping the total rows from all three data sets
- Absorbing differences in labelling — the same country is written
豪州andオーストラリア(Australia), or中国〔香港〕and香港(Hong Kong). Without mapping, they can't be joined, and the rows disappear - Excluding categories with no counterpart — the landing permits data has 148 categories and the visitor arrivals data 26 categories of "things we won't use". Dropping them to match the consumption trend survey's 21 categories is what prompt item 1-(4) means
- Excluding granularity row-wise — dropping the breakdown rows where
費目区分3is filled in (Shinkansen, theme parks and so on), as seen on the previous page, and keeping only the spending item level (accommodation, food and drink…)
5. Writing 0 and Null correctly
- 2026-08: a month for which the cruise data itself does not exist → cruise passengers and general visitors set to Null (21 rows)
- 2026-07, 08: consumption trend survey not yet published → the seven spending-per-person columns set to Null
- Mexico: appears in the consumption trend survey from January-March 2026 → spending per person for 2024-01 to 2025-12 set to Null (visitor counts are present for every month)
- Russia: spending per person for January-March 2024 is 「-」 (not published) in the source data → Null
- Nationalities and regions that don't appear in a month with cruise data get 0 cruise passengers (e.g. Mexico and India in 2024-01). There are 0 rows where general visitors are negative.
Prompt item 1-(8) is carried out exactly. Confirm that rows with 0 and rows with Null both exist, separately.
The last sentence is the most practical in this report. 0 rows with negative general visitors is evidence that the name matching worked. If a country had been missed in the matching, its cruise passengers alone would have landed on a different key, and the subtraction would break in some row.
The AI asks back about something it wasn't told
At the end of the report, two points not covered by the prompt are raised.
Note that visitor arrivals for July and August 2026 are estimates (in units of 100) in the source data. I have set the end of the period to "the last month for which any of the three sources has data". Only the start (January 2024) was specified, so let me know if you would like the end determined differently.
Prompt item 1-(6) fixed only the start. It says nothing about where to end. The AI chose the rule "the last month for which any source has data" itself, and states that it made this choice, leaving room to change it.
The alternative is "the last month for which all three sources have data". That would cut off at 2026-06 and produce no Null rows. In this example we want to see the visitor trend up to August 2026, so we take the longer one.
Visitor arrivals for July and August 2026 are estimates rounded to units of 100. This is the range the AI reported on the Excel parsing page: "the distinction in the 2026 footnote, italics = estimates, can only be told from the cell formatting, so it is not reflected in the Table".
Don't compare the figures for the latest two months with the same precision as the other months. They are too coarse to discuss small increases or decreases by country.
Check the fact table
- Open the Dataflow that was created.
Screenshot shown in the original Japanese.
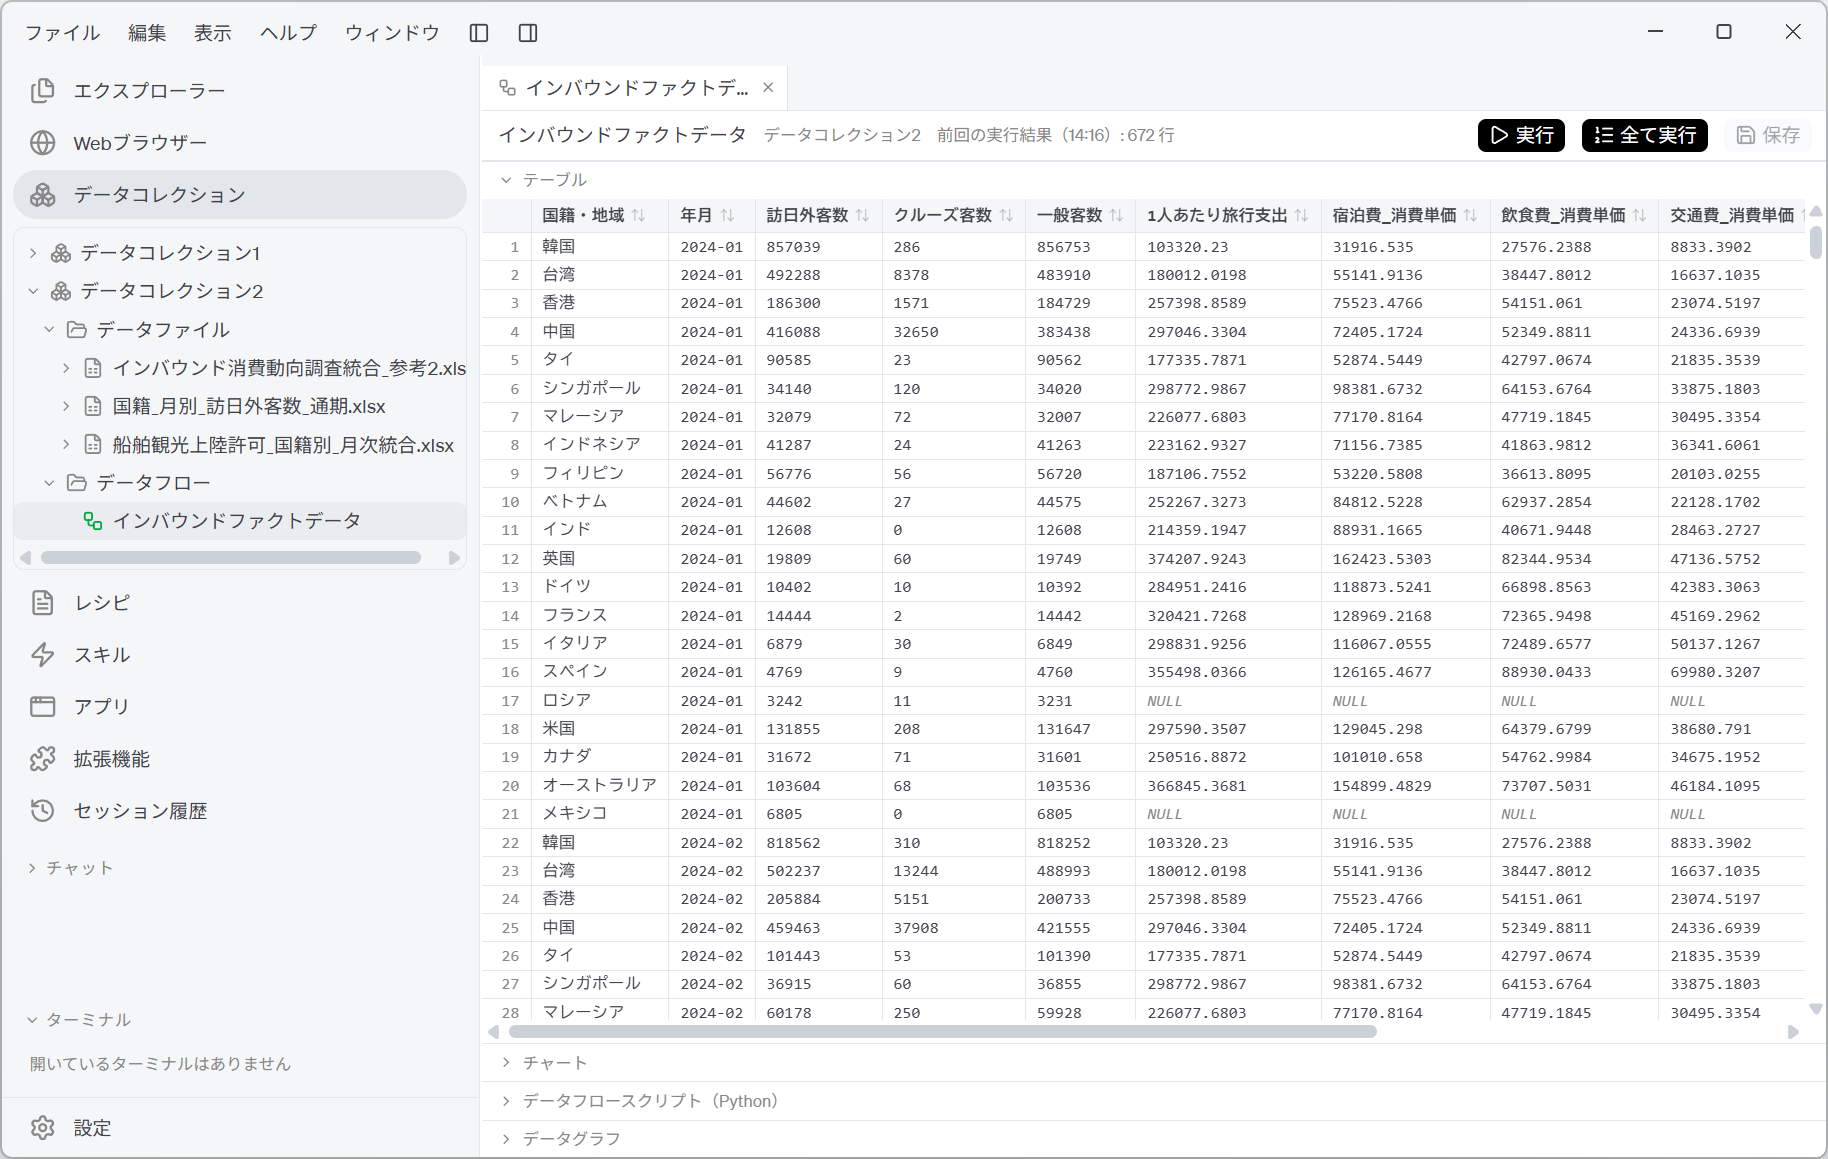
One row is "one nationality or region, in one month". From the left come 国籍・地域 年月, then 訪日外客数 クルーズ客数 一般客数, followed by 1人あたり旅行支出 and the spending per person for each item. The data is now in a form you can use for analysis as it is.
Just looking at the top of the grid shows that the weight of cruise passengers differs enormously by country. In 2024-01, of China's 416,088 visitors 32,650 were cruise passengers, Taiwan had 8,378 out of 492,288, whereas Korea had 286 out of 857,039. This is a scale at which the ranking of countries could change depending on whether or not you subtract.
For Russia in row 17 and Mexico in row 21, the visitor counts are filled in but the spending-per-person columns are NULL. Where these gaps come from is covered in the section below.
In the grid, compare India in 2026-01 (around row 515) with India in 2026-02 (around row 536).
| 2026-01 インド (India) | 2026-02 インド (India) | |
|---|---|---|
| 訪日外客数 | 18,533 | 15,859 |
| クルーズ客数 | 205 | 4 |
| 一般客数 | 18,328 | 15,855 |
| 1人あたり旅行支出 | 212,460.8008 | 212,460.8008 |
| 宿泊費_消費単価 | 83,479.6174 | 83,479.6174 |
| 飲食費_消費単価 | 41,568.2661 | 41,568.2661 |
Only the visitor counts change; the spending per person values are all the same. The consumption trend survey is published only quarterly, so the January-March values are copied into January, February and March.
This is not an error; it is the processing specified in prompt item 1-(3). However, you cannot analyze month-to-month changes in spending per person. Only visitor counts move monthly. If you estimate total spending by month, the only driver of change is the number of visitors.
Human-in-the-loop points
Don't leave everything to the AI; have a person check the following.
-
Check the breakdown of the row count
It is broken down as 672 rows = 21 nationalities and regions × 32 months. Check that the multiplication works out. If it doesn't, there are duplicate keys or missing joins. Read the "zero duplicate keys" report alongside it. -
Check that general visitors make sense as visitor numbers
Check that一般客数 = 訪日外客数 − クルーズ客数is never negative, and that there is no row where cruise passengers exceed visitor arrivals. If nationality names are matched wrongly, this is the first thing to break. Also bear in mind that the share of cruise passengers differs greatly by country. Over the whole period it is about 3% of visitor arrivals, but for China it exceeds 10%. -
Check that 0 and Null are written correctly
There should be both rows where cruise passengers are 0 (countries with no landing permits that month) and rows where they are Null (months for which the statistics are not yet published). If only one kind exists, prompt item 1-(8) has not taken effect. -
Always remember that quarterly values are copied
Spending per person is the same within a quarter. You cannot discuss monthly rises or falls in spending per person. Only visitor counts move monthly. Limit comparisons to those across quarters. -
Check the list of excluded granularities and categories
26 categories have been dropped on the visitor arrivals side and 148 on the landing permits side. Besides 「全国籍・地域」, 「中東」, 「北欧」, 「その他」, 「総数」 and 「アジア計」, countries with no counterpart category in the consumption trend survey, such asマカオ(Macao),中国〔その他〕(China [other]) andニュージーランド(New Zealand), are also excluded. Check that what you want to analyze is not among these exclusions. If you want to look at the Middle East as a whole, for example, it is not in this fact table. -
Inspect the name matching report
The mappings豪州→オーストラリアand中国〔香港〕→香港were made. Check whether any other country is labelled differently. If a mapping is missed, that country's cruise passengers are treated as 0, and general visitors are overstated. The sure way is to check that the count of 21 nationalities and regions is what you expect. -
Check the ends of the period, and how they were decided
The period runs from 2024-01 to 2026-08. The last month covered differs across the three data sets (visitor arrivals 2026-08 / cruise passengers 2026-07 / spending per person April-June 2026). Whether the end is "a month for which any source has data" or "a month for which all sources have data" is a decision for the purpose of the analysis. If you didn't specify it in the prompt, read the AI's choice and confirm it. Also bear in mind that visitor arrivals for July and August 2026 are estimates in units of 100. -
Distinguish where Nulls come from
Nulls have several origins: combinations that could not be joined, cells that were 「-」 in the source data, and months that have not been published at all. When aggregating, the result changes depending on whether you treat Null as 0 or exclude it. -
Tell later stages that the values are copies
Looking at a single row of the fact table, you cannot tell that its spending per person was copied from a quarter. The quarter can be recovered from年月, but when you pass the table on to later processing, state this property explicitly.
There are three kinds of gaps in spending per person, and the reason for each is known. The ends of the period (2026-07, 08) and the added category (Mexico) are predictable from the nature of the data sources.
The remaining one, Russia in January-March 2024, is the column the AI reported on the Excel parsing page: "the two Russia columns for January-March 2024 were - in all 43 rows, and converting them as mixed columns left them entirely missing". The report made during parsing has become the gap after the join, exactly.
If you read the AI's reports instead of skipping them, and keep them, then when blanks appear in later stages you won't have to suspect "this might be a bug". Conversely, when a gap appears whose reason you can't explain, that is the place to investigate.
How granularities are excluded and labelling differences handled vary with the LLM used. Always read the report of what was excluded and what was mapped, and check that it matches your intent. If there is an unreported exclusion, the row count will not add up.
References
The data joined on this page is the three sets of public data obtained and parsed on the previous pages. Screenshots are reproduced as quotations with the source stated. The fact table and the joining decisions made by the AI were generated by GotoAI as an example of Kari's operation; they were not created or published by the Japan Tourism Agency, the Japan National Tourism Organization or the Ministry of Justice.
Consumption trend data
- Material: Consumption Trend Survey for Foreigners Visiting Japan (「インバウンド消費動向調査」; formerly 「訪日外国人消費動向調査」), 「参考2 国籍・地域別 費目別1人1回当たり旅行消費単価(パッケージツアー参加費内訳含む)」 (Reference 2: travel spending per person per trip by nationality, region and spending item, including the breakdown of package tour fees)
- Provider: Japan Tourism Agency (Ministry of Land, Infrastructure, Transport and Tourism)
- URL: https://www.mlit.go.jp/kankocho/tokei_hakusyo/gaikokujinshohidoko.html
- Accessed: October 15, 2026
- Terms of use: In accordance with that website's terms of use. Source: Ministry of Land, Infrastructure, Transport and Tourism website (URL above).
Visitor arrivals data
- Material: JNTO's statistics on visitor arrivals (「訪日外客統計」), 「国籍/月別 訪日外客数」 (visitor arrivals by nationality and month; time-series tables)
- Provider: Japan National Tourism Organization (JNTO)
- URL: https://www.jnto.go.jp/statistics/data/visitors-statistics/
- Accessed: October 15, 2026
- Terms of use: Used with "Japan National Tourism Organization (JNTO)" stated as the source, as that organization requires.
Cruise passenger data
- Material: Immigration control statistics (「出入国管理統計」), 「港別 船舶観光上陸許可を受けた外国人の国籍・地域」 (nationality and region of foreign nationals granted cruise landing permits, by port; monthly tables)
- Provider: Ministry of Justice (Immigration Services Agency of Japan) / Portal Site of Official Statistics of Japan (e-Stat)
- URL: https://www.e-stat.go.jp/stat-search/files?toukei=00250011
- Accessed: October 16, 2026
- Terms of use: In accordance with that site's terms of use. Source: Ministry of Justice, 「出入国管理統計」 (Immigration control statistics).
- The external information quoted on this site is provided to illustrate examples of using Kari. This site does not guarantee the accuracy or currency of that information. Quoted sources may be changed or removed without notice.
- The AI output shown on this site was actually obtained in the stated verification environment. However, this site does not guarantee the accuracy or usefulness of that output. AI output varies with the LLM used, its settings, and from one run to the next.
- This example illustrates how Kari works; the figures it produces may differ from those published by the Japan Tourism Agency.
- The fact table on this page copies quarterly spending per person into each month. The three months of a quarter have identical spending per person; the values do not represent monthly changes in spending per person.
- General visitors are an approximation obtained as "visitor arrivals − cruise landing permits", and are not guaranteed to match the Japan Tourism Agency's estimates.
- Visitor arrivals for July and August 2026 are estimates in units of 100 in the source data. They cannot be compared with the same precision as other months.
- The data on this page includes preliminary figures and data for partial periods. Treat the results of the analysis as valid as of the time the data was obtained.
- In joining, aggregate rows such as totals and regional totals have been excluded. For the excluded granularities, refer to the source data.
- Screenshots were taken with the version of Kari current at the time of writing. The display may differ in your version.
- The organizations quoted have no affiliation with, and do not endorse, this site or Kari.